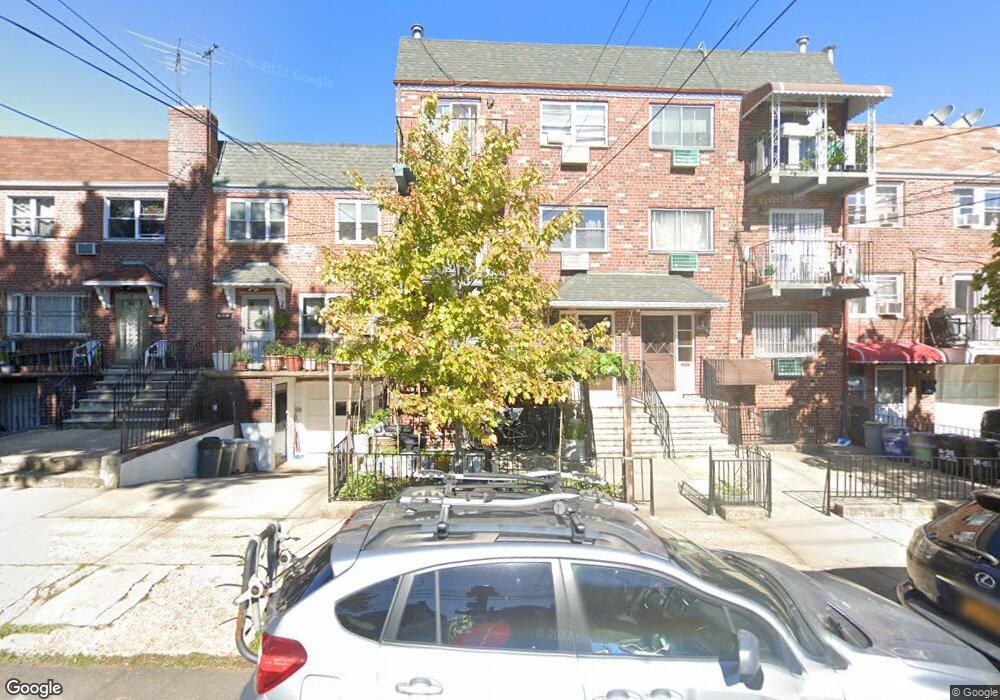
8433 56th Ave Elmhurst, NY 11373
Maspeth NeighborhoodEstimated Value: $1,282,471 - $1,956,000
--
Bed
--
Bath
4,000
Sq Ft
$402/Sq Ft
Est. Value
About This Home
This home is located at 8433 56th Ave, Elmhurst, NY 11373 and is currently estimated at $1,607,868, approximately $401 per square foot. 8433 56th Ave is a home located in Queens County with nearby schools including Ps 58 School Of Heroes, IS 73 - The Frank Sansivieri School, and Newtown High School.
Ownership History
Date
Name
Owned For
Owner Type
Purchase Details
Closed on
Sep 11, 2015
Sold by
Chen Yidi and Chen Youjie
Bought by
Chen Youjie
Current Estimated Value
Purchase Details
Closed on
Nov 9, 2011
Sold by
Chen Zhi Guang and Zheng Lian Jin
Bought by
Dichen Yi Di and Chen Zhi Guang
Home Financials for this Owner
Home Financials are based on the most recent Mortgage that was taken out on this home.
Original Mortgage
$10,749
Interest Rate
4.1%
Mortgage Type
Purchase Money Mortgage
Purchase Details
Closed on
Jul 10, 2007
Sold by
Chan Wai and Chan Yan Yuk
Bought by
Chen Zhi Guang and Zheng Lian Jin
Home Financials for this Owner
Home Financials are based on the most recent Mortgage that was taken out on this home.
Original Mortgage
$584,500
Interest Rate
6.78%
Mortgage Type
Purchase Money Mortgage
Purchase Details
Closed on
May 30, 1996
Sold by
Chin Yuk Chow and Chin Yim Kuen
Bought by
Chin Yim Kuen and Chin Yuk Chow
Create a Home Valuation Report for This Property
The Home Valuation Report is an in-depth analysis detailing your home's value as well as a comparison with similar homes in the area
Home Values in the Area
Average Home Value in this Area
Purchase History
| Date | Buyer | Sale Price | Title Company |
|---|---|---|---|
| Chen Youjie | -- | -- | |
| Chen Youjie | -- | -- | |
| Chen Youjie | -- | -- | |
| Dichen Yi Di | -- | -- | |
| Dichen Yi Di | -- | -- | |
| Chen Zhi Guang | $835,000 | -- | |
| Chen Zhi Guang | $835,000 | -- | |
| Chin Yim Kuen | $35,000 | First American Title Ins Co | |
| Chin Yim Kuen | -- | First American Title Ins Co |
Source: Public Records
Mortgage History
| Date | Status | Borrower | Loan Amount |
|---|---|---|---|
| Previous Owner | Dichen Yi Di | $10,749 | |
| Previous Owner | Chen Zhi Guang | $584,500 |
Source: Public Records
Tax History Compared to Growth
Tax History
| Year | Tax Paid | Tax Assessment Tax Assessment Total Assessment is a certain percentage of the fair market value that is determined by local assessors to be the total taxable value of land and additions on the property. | Land | Improvement |
|---|---|---|---|---|
| 2025 | $13,773 | $72,403 | $18,833 | $53,570 |
| 2024 | $13,774 | $68,576 | $18,062 | $50,514 |
| 2023 | $12,994 | $64,696 | $14,385 | $50,311 |
| 2022 | $12,319 | $105,060 | $25,080 | $79,980 |
| 2021 | $12,987 | $87,060 | $25,080 | $61,980 |
| 2020 | $12,771 | $81,780 | $25,080 | $56,700 |
| 2019 | $11,955 | $84,000 | $25,080 | $58,920 |
| 2018 | $10,990 | $53,913 | $18,351 | $35,562 |
| 2017 | $10,483 | $51,424 | $19,039 | $32,385 |
| 2016 | $10,280 | $51,424 | $19,039 | $32,385 |
| 2015 | $5,631 | $50,280 | $27,900 | $22,380 |
| 2014 | $5,631 | $47,623 | $26,973 | $20,650 |
Source: Public Records
Map
Nearby Homes
- 85-21 56th Ave
- 84-24 57th Rd
- 5434 83rd St
- 53-16 Haspel St
- 85-30 57th Ave Unit 1A
- 52-57 84th St
- 8318 58th Ave
- 5810 83rd Place
- 8230 58th Ave
- 86-20 57th Rd
- 58-05 Van Horn St
- 8638 57th Ave
- 58-25 83rd St
- 5738&40&44 Seabury St
- 86-41 55th Ave
- 86-38 54th Ave
- 84-38 Grand Ave
- 57-57 81st St
- 84-26 60th Ave
- 8426 60th Ave
- 8431 56th Ave
- 8435 56th Ave
- 84-29 56th Ave Unit 2 Fl
- 84-29 56th Ave Unit 1Fl
- 84-29 56th Ave
- 8429 56th Ave
- 8439 56th Ave
- 84-39 56th Ave Unit 3
- 8441 56th Ave
- 84-27 56th Ave Unit 1st FL
- 8427 56th Ave
- 84-43 56th Ave Unit 1Fl
- 84-43 56th Ave
- 8443 56th Ave Unit 1Fl
- 8443 56th Ave
- 8434 55th Rd
- 8432 55th Rd
- 8438 55th Rd
- 8423 56th Ave
- 8436 55th Rd