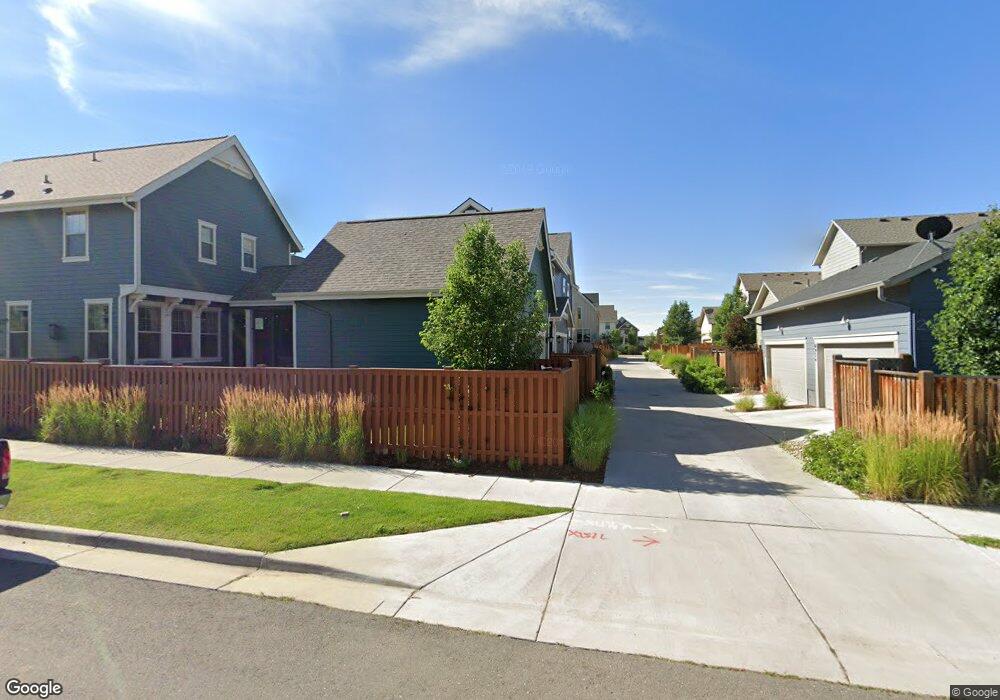
8434 E 49th Dr Denver, CO 80238
Central Park NeighborhoodEstimated Value: $721,008 - $822,000
4
Beds
4
Baths
2,854
Sq Ft
$271/Sq Ft
Est. Value
About This Home
This home is located at 8434 E 49th Dr, Denver, CO 80238 and is currently estimated at $773,502, approximately $271 per square foot. 8434 E 49th Dr is a home located in Denver County with nearby schools including Willow Elementary, Swigert International School, and Westerly Creek Elementary.
Ownership History
Date
Name
Owned For
Owner Type
Purchase Details
Closed on
Feb 21, 2019
Sold by
Walk Family Trust
Bought by
Agartan Karacaer Caner and Agartan Karacaer Elif
Current Estimated Value
Home Financials for this Owner
Home Financials are based on the most recent Mortgage that was taken out on this home.
Original Mortgage
$520,000
Outstanding Balance
$452,496
Interest Rate
4.4%
Mortgage Type
New Conventional
Estimated Equity
$321,006
Purchase Details
Closed on
Dec 4, 2017
Sold by
Walk Laurel K and Walk Justin M
Bought by
Walk Family Trust
Purchase Details
Closed on
May 19, 2014
Sold by
Kb Home Colorado Inc
Bought by
Walk Laurel K and Walk Justin M
Home Financials for this Owner
Home Financials are based on the most recent Mortgage that was taken out on this home.
Original Mortgage
$394,391
Interest Rate
4.46%
Mortgage Type
New Conventional
Create a Home Valuation Report for This Property
The Home Valuation Report is an in-depth analysis detailing your home's value as well as a comparison with similar homes in the area
Home Values in the Area
Average Home Value in this Area
Purchase History
| Date | Buyer | Sale Price | Title Company |
|---|---|---|---|
| Agartan Karacaer Caner | $650,000 | Canyon Title | |
| Walk Family Trust | -- | None Available | |
| Walk Laurel K | $415,149 | First American |
Source: Public Records
Mortgage History
| Date | Status | Borrower | Loan Amount |
|---|---|---|---|
| Open | Agartan Karacaer Caner | $520,000 | |
| Previous Owner | Walk Laurel K | $394,391 |
Source: Public Records
Tax History
| Year | Tax Paid | Tax Assessment Tax Assessment Total Assessment is a certain percentage of the fair market value that is determined by local assessors to be the total taxable value of land and additions on the property. | Land | Improvement |
|---|---|---|---|---|
| 2025 | $6,743 | $51,780 | $8,460 | $8,460 |
| 2024 | $6,743 | $46,090 | $4,360 | $41,730 |
| 2023 | $6,653 | $46,090 | $4,360 | $41,730 |
| 2022 | $5,091 | $36,030 | $8,340 | $27,690 |
| 2021 | $5,022 | $37,070 | $8,580 | $28,490 |
| 2020 | $5,018 | $37,460 | $8,580 | $28,880 |
| 2019 | $4,942 | $37,460 | $8,580 | $28,880 |
| 2018 | $4,436 | $32,250 | $7,960 | $24,290 |
| 2017 | $4,430 | $32,250 | $7,960 | $24,290 |
| 2016 | $4,326 | $31,250 | $6,288 | $24,962 |
| 2015 | $4,211 | $31,250 | $6,288 | $24,962 |
| 2014 | $833 | $5,990 | $2,818 | $3,172 |
Source: Public Records
Map
Nearby Homes
- 4977 Valentia St
- 8565 E 50th Dr
- 5063 Valentia St
- 8484 E 51st Ave
- 8072 E 49th Place
- 5078 Uinta St
- 4987 Akron St
- 4974 Akron St
- 9033 E Northfield Blvd
- 7984 E 51st Ave
- 8612 E 47th Ave
- 8055 E Prairie Meadow Dr
- 8659 E 54th Ave
- 5255 Central Park Blvd
- 8197 E 53rd Dr
- 8518 E 54th Place
- 5440 Uinta St
- 5462 Valentia St
- 7959 E 54th Place
- 5497 Verbena St
- 8424 E 49th Dr
- 4972 Verbena St
- 4970 Verbena St
- 8454 E 49th Dr
- 4966 Verbena St
- 4974 Verbena St
- 4960 Verbena St
- 8423 E 49th Place
- 8453 E 49th Place
- 8474 E 49th Dr
- 4958 Verbena St
- 4956 Verbena St
- 8473 E 49th Place
- 8494 E 49th Dr
- 8435 E 49th Dr
- 8415 E 49th Dr
- 8493 E 49th Place
- 8455 E 49th Dr
- 8405 E 49th Dr
- 8475 E 49th Dr
Your Personal Tour Guide
Ask me questions while you tour the home.