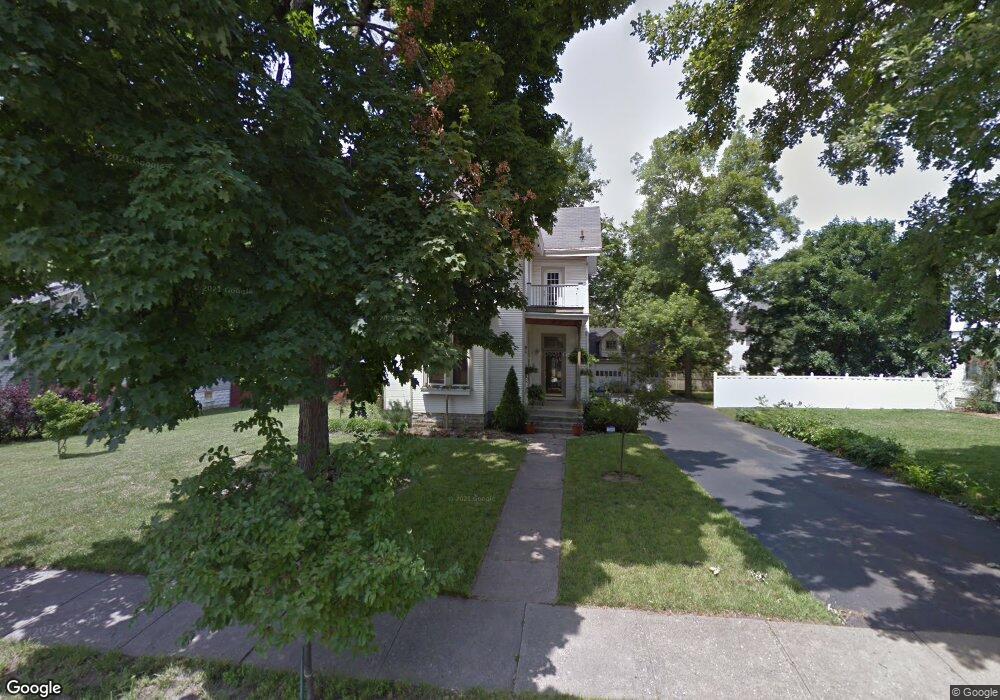
8435 Curzon Ave Cincinnati, OH 45216
Hartwell NeighborhoodEstimated Value: $143,000 - $241,000
2
Beds
2
Baths
1,675
Sq Ft
$121/Sq Ft
Est. Value
About This Home
This home is located at 8435 Curzon Ave, Cincinnati, OH 45216 and is currently estimated at $201,960, approximately $120 per square foot. 8435 Curzon Ave is a home located in Hamilton County with nearby schools including Rising Stars at Carthage, Hartwell School, and Shroder High School.
Ownership History
Date
Name
Owned For
Owner Type
Purchase Details
Closed on
Dec 28, 2001
Sold by
Dean Clingerman and Dean Betty
Bought by
Moeller Karen
Current Estimated Value
Home Financials for this Owner
Home Financials are based on the most recent Mortgage that was taken out on this home.
Original Mortgage
$113,400
Outstanding Balance
$46,736
Interest Rate
7.16%
Estimated Equity
$155,224
Purchase Details
Closed on
Dec 11, 2000
Sold by
Clingerman Dean H and Clingerman Betty W
Bought by
Biddle Karen J
Home Financials for this Owner
Home Financials are based on the most recent Mortgage that was taken out on this home.
Original Mortgage
$107,100
Interest Rate
10%
Mortgage Type
Seller Take Back
Purchase Details
Closed on
Mar 25, 1999
Sold by
Littrell Marvin
Bought by
Clingerman Dean and Clingerman Betty
Home Financials for this Owner
Home Financials are based on the most recent Mortgage that was taken out on this home.
Original Mortgage
$84,800
Interest Rate
6.94%
Create a Home Valuation Report for This Property
The Home Valuation Report is an in-depth analysis detailing your home's value as well as a comparison with similar homes in the area
Home Values in the Area
Average Home Value in this Area
Purchase History
| Date | Buyer | Sale Price | Title Company |
|---|---|---|---|
| Moeller Karen | $119,000 | Jets Title Agency Llc | |
| Biddle Karen J | $119,000 | -- | |
| Clingerman Dean | $68,000 | -- |
Source: Public Records
Mortgage History
| Date | Status | Borrower | Loan Amount |
|---|---|---|---|
| Open | Moeller Karen | $113,400 | |
| Previous Owner | Biddle Karen J | $107,100 | |
| Previous Owner | Clingerman Dean | $84,800 |
Source: Public Records
Tax History Compared to Growth
Tax History
| Year | Tax Paid | Tax Assessment Tax Assessment Total Assessment is a certain percentage of the fair market value that is determined by local assessors to be the total taxable value of land and additions on the property. | Land | Improvement |
|---|---|---|---|---|
| 2024 | $2,505 | $41,335 | $8,225 | $33,110 |
| 2023 | $2,557 | $41,335 | $8,225 | $33,110 |
| 2022 | $1,784 | $25,704 | $8,127 | $17,577 |
| 2021 | $1,713 | $25,704 | $8,127 | $17,577 |
| 2020 | $1,758 | $25,704 | $8,127 | $17,577 |
| 2019 | $1,781 | $23,800 | $7,525 | $16,275 |
| 2018 | $1,783 | $23,800 | $7,525 | $16,275 |
| 2017 | $2,929 | $41,419 | $7,525 | $33,894 |
| 2016 | $1,720 | $23,800 | $7,875 | $15,925 |
| 2015 | $1,551 | $23,800 | $7,875 | $15,925 |
| 2014 | $1,561 | $23,800 | $7,875 | $15,925 |
| 2013 | $3,033 | $45,836 | $7,875 | $37,961 |
Source: Public Records
Map
Nearby Homes
- 8421 Wiswell St
- 8410 Curzon Ave
- 8442 Anthony Wayne Ave
- 81 Hillsdale Ave
- 54 Hereford St
- 59 Ferndale Ave
- 177 Burns Ave
- 504 Olden Ave
- 223 Kearney St
- 505 Olden Ave
- 214 Harriet St
- 715 Worthington Ave
- 410 Rolef Ave
- 20 Sherry Rd
- 334 Williams St
- 645 Blanche Ave
- 7901 Glenorchard Dr
- 29 Hartwell Ct
- 7871 Glenorchard Dr
- 7866 Greenland Place
- 8429 Curzon Ave
- 8443 Curzon Ave
- 8440 Wiswell St
- 8425 Curzon Ave
- 8434 Wiswell St
- 8448 Wiswell St
- 8432 Wiswell St
- 8421 Curzon Ave
- 8451 Curzon Ave
- 8436 Curzon Ave
- 8456 Wiswell St
- 8432 Curzon Ave
- 8442 Curzon Ave
- 8428 Wiswell St
- 8428 Curzon Ave
- 8458 Wiswell St
- 8417 Curzon Ave
- 8424 Curzon Ave
- 8457 Curzon Ave
- 8424 Wiswell St