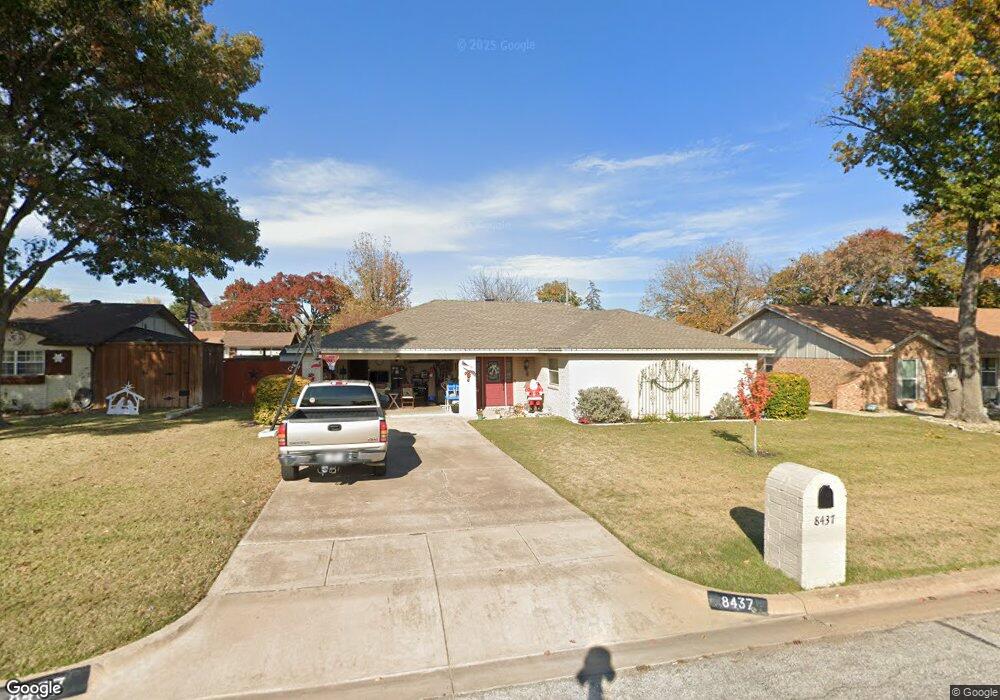
8437 Main St North Richland Hills, TX 76182
Estimated Value: $310,000 - $362,000
3
Beds
2
Baths
1,451
Sq Ft
$227/Sq Ft
Est. Value
About This Home
This home is located at 8437 Main St, North Richland Hills, TX 76182 and is currently estimated at $329,099, approximately $226 per square foot. 8437 Main St is a home located in Tarrant County with nearby schools including Walker Creek Elementary School, Smithfield Middle School, and Birdville High School.
Ownership History
Date
Name
Owned For
Owner Type
Purchase Details
Closed on
Jun 22, 1999
Sold by
Durham Fred D
Bought by
Cook Michael D and Cookston Jo Ann
Current Estimated Value
Home Financials for this Owner
Home Financials are based on the most recent Mortgage that was taken out on this home.
Original Mortgage
$63,920
Outstanding Balance
$20,908
Interest Rate
9.95%
Estimated Equity
$308,191
Create a Home Valuation Report for This Property
The Home Valuation Report is an in-depth analysis detailing your home's value as well as a comparison with similar homes in the area
Home Values in the Area
Average Home Value in this Area
Purchase History
| Date | Buyer | Sale Price | Title Company |
|---|---|---|---|
| Cook Michael D | -- | Safeco Land Title |
Source: Public Records
Mortgage History
| Date | Status | Borrower | Loan Amount |
|---|---|---|---|
| Open | Cook Michael D | $63,920 | |
| Closed | Cook Michael D | $15,980 |
Source: Public Records
Tax History Compared to Growth
Tax History
| Year | Tax Paid | Tax Assessment Tax Assessment Total Assessment is a certain percentage of the fair market value that is determined by local assessors to be the total taxable value of land and additions on the property. | Land | Improvement |
|---|---|---|---|---|
| 2025 | $3,399 | $243,498 | $91,800 | $151,698 |
| 2024 | $3,399 | $243,498 | $91,800 | $151,698 |
| 2023 | $4,594 | $243,353 | $91,800 | $151,553 |
| 2022 | $4,581 | $190,373 | $40,000 | $150,373 |
| 2021 | $4,521 | $182,375 | $40,000 | $142,375 |
| 2020 | $4,110 | $188,568 | $40,000 | $148,568 |
| 2019 | $3,867 | $189,871 | $40,000 | $149,871 |
| 2018 | $3,035 | $133,499 | $40,000 | $93,499 |
| 2017 | $3,265 | $154,552 | $35,000 | $119,552 |
| 2016 | $2,968 | $135,121 | $17,000 | $118,121 |
| 2015 | $2,387 | $100,300 | $17,000 | $83,300 |
| 2014 | $2,387 | $100,300 | $17,000 | $83,300 |
Source: Public Records
Map
Nearby Homes
- 8412 Glenann Dr
- 8409 Main St
- 8409 Glenann Dr
- 8421 Randy Dr
- 8420 Town Walk Dr
- 8436 Town Walk Dr
- 6921 Westover Way
- 6509 Paula Ct
- 6432 Brynwyck Ln
- 8220 Odell St
- 8440 Stephanie Dr
- 8740 Ice House Dr
- 6625 Crane Rd
- 8412 Timberline Ct
- 6137 Marquita Mews
- 8920 Martin Dr
- 6505 Parkway Ave
- 6116 Morningside Dr
- 8748 Morris Mews
- 0 Mid Cities Blvd