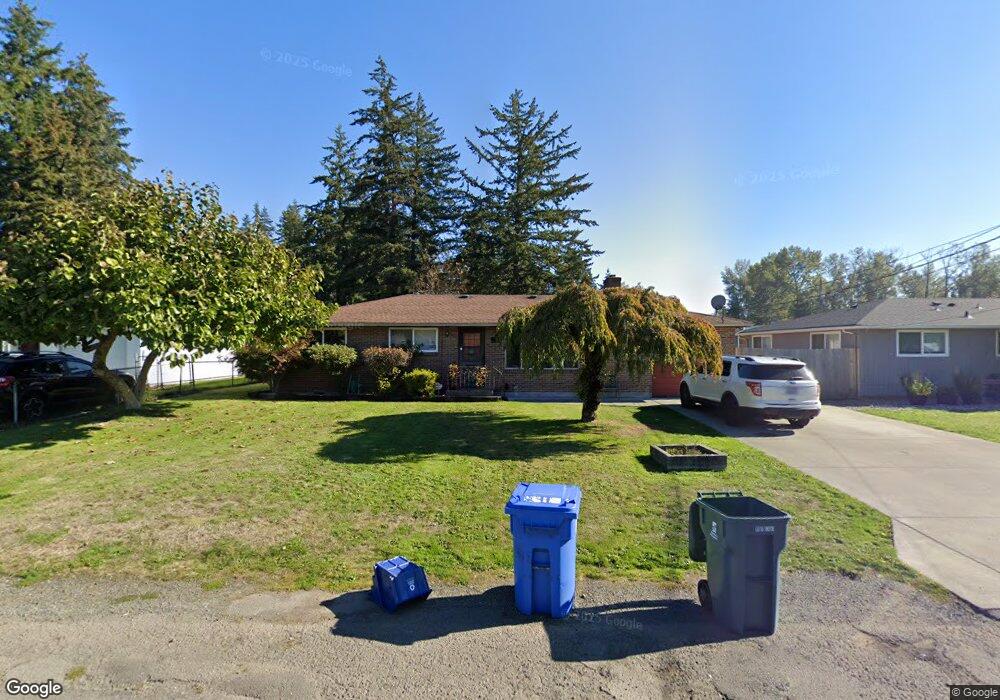
8439 E E St Tacoma, WA 98445
South End NeighborhoodEstimated Value: $418,000 - $458,000
About This Home
This home is located at 8439 E E St, Tacoma, WA 98445 and is currently estimated at $439,747, approximately $365 per square foot. 8439 E E St is a home located in Pierce County with nearby schools including Larchmont Elementary School, Baker Middle School, and Mount Tahoma High School.
Ownership History
We collect this data history from publicly available records. To have your information removed, we recommend requesting removal directly through your county’s website.
Purchase Details
Home Financials for this Owner
Home Financials are based on the most recent Mortgage that was taken out on this home.Purchase Details
Home Values in the Area
Average Home Value in this Area
Purchase History
We collect this data history from publicly available records. To have your information removed, we recommend requesting removal directly through your county’s website.
| Date | Buyer | Sale Price | Title Company |
|---|---|---|---|
| $151,241 | -- | ||
| -- | -- |
Mortgage History
We collect this data history from publicly available records. To have your information removed, we recommend requesting removal directly through your county’s website.
| Date | Status | Borrower | Loan Amount |
|---|---|---|---|
| Open | $104,000 | ||
| Closed | $26,000 |
Tax History
We collect this data history from publicly available records. To have your information removed, we recommend requesting removal directly through your county’s website.
| Year | Tax Paid | Tax Assessment Tax Assessment Total Assessment is a certain percentage of the fair market value that is determined by local assessors to be the total taxable value of land and additions on the property. | Land | Improvement |
|---|---|---|---|---|
| 2025 | $4,333 | $401,200 | $189,300 | $211,900 |
| 2024 | $4,333 | $414,600 | $191,200 | $223,400 |
| 2023 | $4,333 | $389,100 | $183,400 | $205,700 |
| 2022 | $3,856 | $399,200 | $176,900 | $222,300 |
| 2021 | $3,627 | $288,400 | $115,900 | $172,500 |
| 2019 | $3,090 | $265,500 | $99,200 | $166,300 |
| 2018 | $3,218 | $237,600 | $80,600 | $157,000 |
| 2017 | $2,823 | $203,600 | $61,800 | $141,800 |
| 2016 | $2,533 | $154,300 | $46,700 | $107,600 |
| 2014 | $2,082 | $145,600 | $45,300 | $100,300 |
| 2013 | $2,082 | $126,500 | $38,500 | $88,000 |
Map
- 416 E 86th St
- 8423 E D St
- 614 E 84th St
- 308 E 84th St
- 8446 E B St
- 8818 E D St
- 8827 B D St E Unit 2
- 8827 A D St E Unit 1
- 8235 E B St
- 8518 9th Ave E
- 803 82nd Street Ct E Unit 14
- 818 82nd St E Unit 6
- 917 85th St E
- 605 E 91st St
- 7918 Mckinley Ave
- 9126 E G St
- 8519 Golden Given Rd E
- 521 E 78th St
- 0 E 93rd St
- 8839 Pacific Ave
Ask me questions while you tour the home.