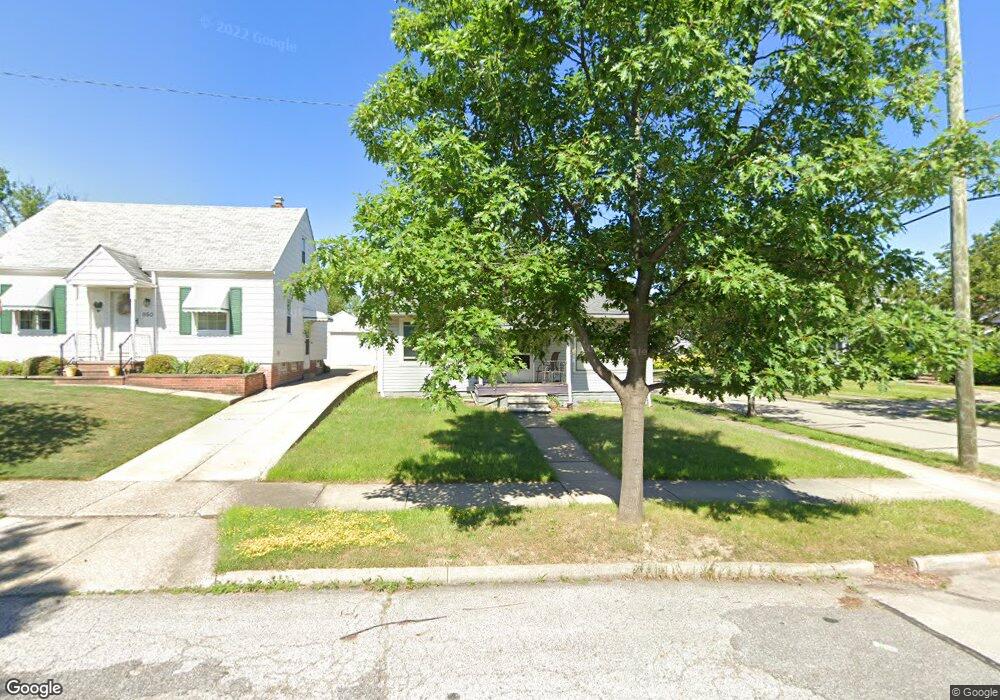
844 E 230th St Euclid, OH 44123
Estimated Value: $104,665 - $131,000
3
Beds
1
Bath
1,110
Sq Ft
$105/Sq Ft
Est. Value
About This Home
This home is located at 844 E 230th St, Euclid, OH 44123 and is currently estimated at $116,916, approximately $105 per square foot. 844 E 230th St is a home located in Cuyahoga County with nearby schools including Arbor Elementary School, Euclid Middle School, and Euclid High School.
Ownership History
Date
Name
Owned For
Owner Type
Purchase Details
Closed on
Mar 16, 2001
Sold by
Waller Marlene
Bought by
Hackney Brad
Current Estimated Value
Home Financials for this Owner
Home Financials are based on the most recent Mortgage that was taken out on this home.
Original Mortgage
$75,905
Outstanding Balance
$25,759
Interest Rate
7.13%
Estimated Equity
$91,157
Purchase Details
Closed on
Aug 9, 1996
Sold by
Hayward Harold W
Bought by
Waller Marlene
Home Financials for this Owner
Home Financials are based on the most recent Mortgage that was taken out on this home.
Original Mortgage
$35,750
Interest Rate
8.33%
Mortgage Type
New Conventional
Purchase Details
Closed on
Feb 13, 1980
Sold by
Hayward Harold W and Hayward Catherine M
Bought by
Hayward Harold W
Purchase Details
Closed on
Jan 1, 1975
Bought by
Hayward Harold W and Hayward Catherine M
Create a Home Valuation Report for This Property
The Home Valuation Report is an in-depth analysis detailing your home's value as well as a comparison with similar homes in the area
Home Values in the Area
Average Home Value in this Area
Purchase History
| Date | Buyer | Sale Price | Title Company |
|---|---|---|---|
| Hackney Brad | $78,900 | First Service Title Agency I | |
| Waller Marlene | $55,000 | -- | |
| Hayward Harold W | -- | -- | |
| Hayward Harold W | -- | -- |
Source: Public Records
Mortgage History
| Date | Status | Borrower | Loan Amount |
|---|---|---|---|
| Open | Hackney Brad | $75,905 | |
| Previous Owner | Waller Marlene | $35,750 |
Source: Public Records
Tax History
| Year | Tax Paid | Tax Assessment Tax Assessment Total Assessment is a certain percentage of the fair market value that is determined by local assessors to be the total taxable value of land and additions on the property. | Land | Improvement |
|---|---|---|---|---|
| 2025 | $2,209 | $32,515 | $7,315 | $25,200 |
| 2024 | $2,278 | $32,515 | $7,315 | $25,200 |
| 2023 | $2,002 | $22,650 | $5,740 | $16,910 |
| 2022 | $1,958 | $22,650 | $5,740 | $16,910 |
| 2021 | $2,172 | $22,650 | $5,740 | $16,910 |
| 2020 | $1,830 | $17,150 | $4,340 | $12,810 |
| 2019 | $1,642 | $49,000 | $12,400 | $36,600 |
| 2018 | $1,612 | $17,150 | $4,340 | $12,810 |
| 2017 | $1,697 | $14,670 | $2,910 | $11,760 |
| 2016 | $1,701 | $14,670 | $2,910 | $11,760 |
| 2015 | $1,552 | $14,670 | $2,910 | $11,760 |
| 2014 | $1,552 | $14,670 | $2,910 | $11,760 |
Source: Public Records
Map
Nearby Homes
- 22931 Arms Ave
- 934 E 223rd St
- 942 E 236th St
- 860 E 232nd St
- 22350 Tracy Ave
- 21840 Miller Ave
- 21130 Arbor Ave
- 21300 Wilmore Ave
- 21250 Wilmore Ave
- 21170 Wilmore Ave
- 21131 Morris Ave
- 21391 Westport Ave
- 21481 Ball Ave
- 797 Babbitt Rd Unit 15
- 20871 Trebec Blvd
- 21971 Crystal Ave
- 20890 Morris Ave
- 20830 Tracy Ave
- 23219 Bennington Hamlet Cir
- 21670 Crystal Ave
Your Personal Tour Guide
Ask me questions while you tour the home.