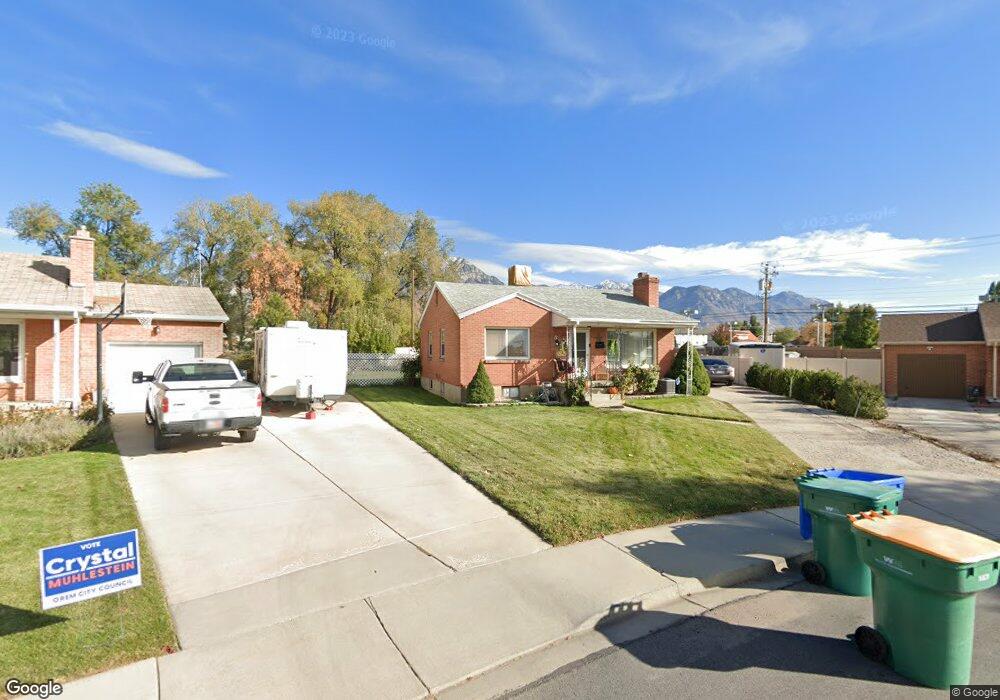
844 Memo Dr Orem, UT 84057
Windsor NeighborhoodEstimated Value: $396,000 - $423,000
2
Beds
1
Bath
832
Sq Ft
$497/Sq Ft
Est. Value
About This Home
This home is located at 844 Memo Dr, Orem, UT 84057 and is currently estimated at $413,167, approximately $496 per square foot. 844 Memo Dr is a home located in Utah County with nearby schools including Windsor School, Canyon View Junior High School, and Timpanogos High School.
Ownership History
Date
Name
Owned For
Owner Type
Purchase Details
Closed on
Nov 15, 2025
Sold by
Lamoreaux Brock Longman and Lamoreaux Pamela
Bought by
Berge & Berge Llc
Current Estimated Value
Purchase Details
Closed on
Oct 17, 2022
Sold by
Lamoreaux Erwin C
Bought by
Lamoreaux Brock Longman and Lamoreaux Pamela
Home Financials for this Owner
Home Financials are based on the most recent Mortgage that was taken out on this home.
Original Mortgage
$371,896
Interest Rate
5.66%
Mortgage Type
FHA
Create a Home Valuation Report for This Property
The Home Valuation Report is an in-depth analysis detailing your home's value as well as a comparison with similar homes in the area
Home Values in the Area
Average Home Value in this Area
Purchase History
| Date | Buyer | Sale Price | Title Company |
|---|---|---|---|
| Berge & Berge Llc | -- | United West Title | |
| Lamoreaux Brock Longman | -- | Inwest Title |
Source: Public Records
Mortgage History
| Date | Status | Borrower | Loan Amount |
|---|---|---|---|
| Previous Owner | Lamoreaux Brock Longman | $371,896 |
Source: Public Records
Tax History
| Year | Tax Paid | Tax Assessment Tax Assessment Total Assessment is a certain percentage of the fair market value that is determined by local assessors to be the total taxable value of land and additions on the property. | Land | Improvement |
|---|---|---|---|---|
| 2025 | $1,608 | $206,415 | -- | -- |
| 2024 | $1,608 | $196,680 | $0 | $0 |
| 2023 | $1,456 | $191,345 | $0 | $0 |
| 2022 | $1,614 | $205,480 | $0 | $0 |
| 2021 | $1,369 | $264,000 | $138,900 | $125,100 |
| 2020 | $1,233 | $233,700 | $111,100 | $122,600 |
| 2019 | $1,130 | $222,700 | $100,300 | $122,400 |
| 2018 | $1,041 | $196,000 | $89,600 | $106,400 |
| 2017 | $960 | $96,855 | $0 | $0 |
| 2016 | $842 | $78,320 | $0 | $0 |
| 2015 | $820 | $72,160 | $0 | $0 |
| 2014 | $824 | $72,160 | $0 | $0 |
Source: Public Records
Map
Nearby Homes
Your Personal Tour Guide
Ask me questions while you tour the home.