Estimated Value: $340,484 - $384,000
2
Beds
3
Baths
1,354
Sq Ft
$260/Sq Ft
Est. Value
About This Home
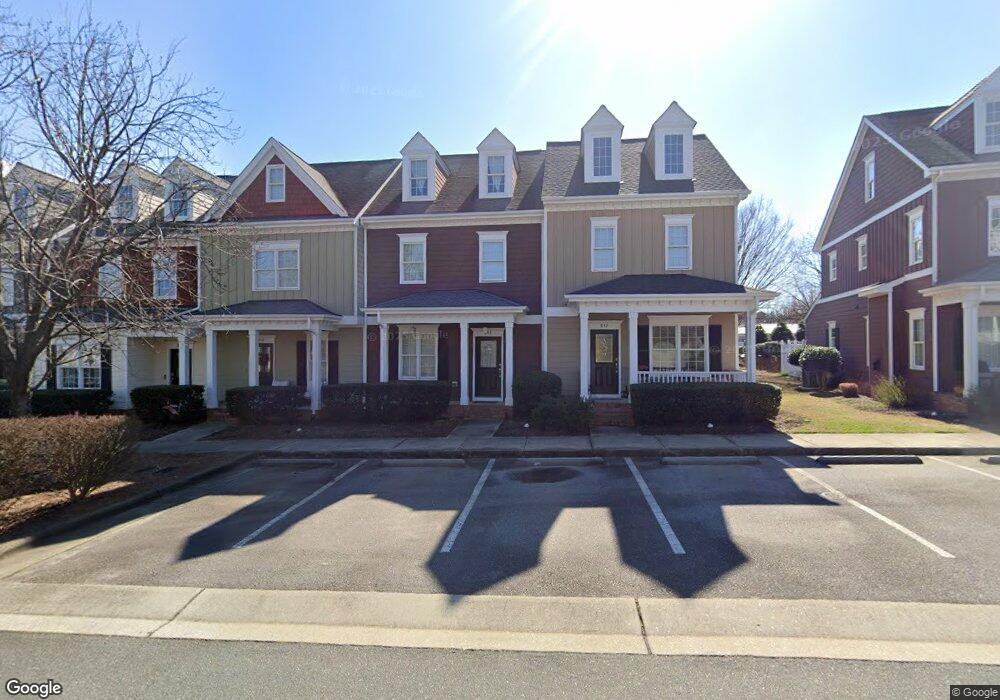
This home is located at 844 Myrtle Grove Ln Unit F, Apex, NC 27502 and is currently estimated at $352,621, approximately $260 per square foot. 844 Myrtle Grove Ln Unit F is a home located in Wake County with nearby schools including Apex Elementary School, Apex Middle, and Apex High School.
Ownership History
Date
Name
Owned For
Owner Type
Purchase Details
Closed on
Jul 7, 2015
Sold by
Sims Shakera L
Bought by
Patel Manij and Patel Anita
Current Estimated Value
Home Financials for this Owner
Home Financials are based on the most recent Mortgage that was taken out on this home.
Original Mortgage
$146,800
Outstanding Balance
$111,970
Interest Rate
3.25%
Mortgage Type
Adjustable Rate Mortgage/ARM
Estimated Equity
$240,651
Purchase Details
Closed on
Oct 10, 2012
Sold by
Waymire Joshua M
Bought by
Sims Shakera L
Purchase Details
Closed on
Jun 25, 2008
Sold by
Jvi Construction Inc
Bought by
Waymire Joshua M and Sims Shakera
Home Financials for this Owner
Home Financials are based on the most recent Mortgage that was taken out on this home.
Original Mortgage
$171,147
Interest Rate
5.97%
Mortgage Type
FHA
Create a Home Valuation Report for This Property
The Home Valuation Report is an in-depth analysis detailing your home's value as well as a comparison with similar homes in the area
Home Values in the Area
Average Home Value in this Area
Purchase History
| Date | Buyer | Sale Price | Title Company |
|---|---|---|---|
| Patel Manij | $183,500 | Attorney | |
| Sims Shakera L | -- | None Available | |
| Waymire Joshua M | $173,000 | None Available |
Source: Public Records
Mortgage History
| Date | Status | Borrower | Loan Amount |
|---|---|---|---|
| Open | Patel Manij | $146,800 | |
| Previous Owner | Waymire Joshua M | $171,147 |
Source: Public Records
Tax History Compared to Growth
Tax History
| Year | Tax Paid | Tax Assessment Tax Assessment Total Assessment is a certain percentage of the fair market value that is determined by local assessors to be the total taxable value of land and additions on the property. | Land | Improvement |
|---|---|---|---|---|
| 2025 | $3,031 | $344,822 | $65,000 | $279,822 |
| 2024 | $2,963 | $344,822 | $65,000 | $279,822 |
| 2023 | $2,622 | $237,168 | $40,000 | $197,168 |
| 2022 | $2,462 | $237,168 | $40,000 | $197,168 |
| 2021 | $2,368 | $237,168 | $40,000 | $197,168 |
| 2020 | $2,344 | $237,168 | $40,000 | $197,168 |
| 2019 | $2,066 | $180,174 | $30,000 | $150,174 |
| 2018 | $1,947 | $180,174 | $30,000 | $150,174 |
| 2017 | $1,813 | $180,174 | $30,000 | $150,174 |
| 2016 | $1,787 | $180,174 | $30,000 | $150,174 |
| 2015 | $1,822 | $179,375 | $30,000 | $149,375 |
| 2014 | $1,756 | $179,375 | $30,000 | $149,375 |
Source: Public Records
Map
Nearby Homes
- 214 Williams Grove Ln Unit Lot 4
- 218 Williams Grove Ln
- 226 Williams Grove Ln
- 262 Williams Grove Ln Unit Lot 76
- 268 Williams Grove Ln Unit Lot 75
- 278 Williams Grove Ln Unit Lot 73
- 286 Williams Grove Ln Unit Lot 71
- 294 Williams Grove Ln Unit 69
- 294 Williams Grove Ln
- 298 Williams Grove Ln N Unit 68
- 295 Williams Grove Ln Unit Lot 67
- 285 Williams Grove Ln Unit Lot 65
- 281 Williams Grove Ln Unit Lot 64
- 281 Williams Grove Ln
- 265 Williams Grove Ln
- 273 Williams Grove Ln Unit Lot 62
- 635 Sawcut Ln
- 631 Sawcut Ln
- 633 Sawcut Ln
- 1511 Waterland Dr
- 846 Myrtle Grove Dr Ln
- 846 Myrtle Grove Ln
- 846 Myrtle Grove Ln Unit A
- 844 Myrtle Grove Ln
- 848 Myrtle Grove Ln
- 848 Myrtle Grove Ln Unit C
- 842 Myrtle Grove Ln
- 842 Myrtle Grove Ln Unit B2
- 850 Myrtle Grove Ln
- 850 Myrtle Grove Ln Unit B2
- 838 Myrtle Grove Ln
- 838 Myrtle Grove Ln Unit B2
- 836 Myrtle Grove Ln
- 836 Myrtle Grove Ln Unit F
- 834 Myrtle Grove Ln
- 834 Myrtle Grove Ln Unit A
- 832 Myrtle Grove Ln
- 832 Myrtle Grove Ln Unit B2
- 1301 Center St
- 1300 Forest Grove Dr