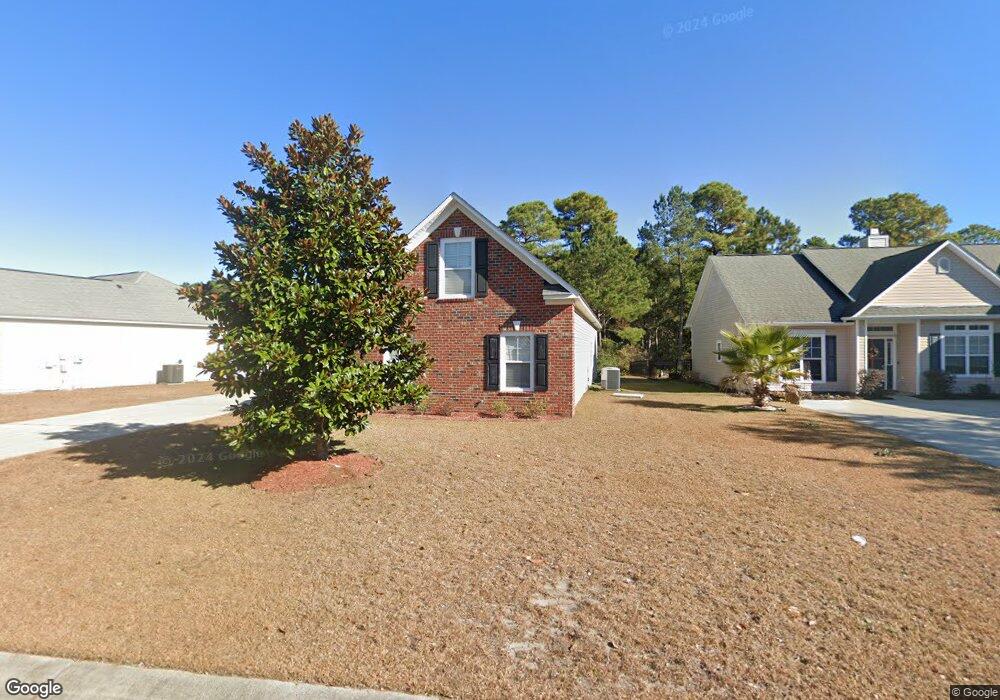
844 Pembridge Ct Myrtle Beach, SC 29579
Pine Island NeighborhoodEstimated Value: $348,074 - $414,000
3
Beds
2
Baths
1,954
Sq Ft
$198/Sq Ft
Est. Value
About This Home
This home is located at 844 Pembridge Ct, Myrtle Beach, SC 29579 and is currently estimated at $386,519, approximately $197 per square foot. 844 Pembridge Ct is a home located in Horry County with nearby schools including River Oaks Elementary School, Ocean Bay Middle School, and Carolina Forest High School.
Ownership History
Date
Name
Owned For
Owner Type
Purchase Details
Closed on
Dec 10, 2012
Sold by
Federal National Mortgage Association
Bought by
Wang Kun
Current Estimated Value
Purchase Details
Closed on
Nov 28, 2005
Sold by
Centex Homes
Bought by
Elsner Dale and Elsner Mary Ann
Home Financials for this Owner
Home Financials are based on the most recent Mortgage that was taken out on this home.
Original Mortgage
$25,050
Interest Rate
6.1%
Mortgage Type
Stand Alone Second
Create a Home Valuation Report for This Property
The Home Valuation Report is an in-depth analysis detailing your home's value as well as a comparison with similar homes in the area
Home Values in the Area
Average Home Value in this Area
Purchase History
| Date | Buyer | Sale Price | Title Company |
|---|---|---|---|
| Wang Kun | $173,000 | -- | |
| Elsner Dale | $247,040 | -- |
Source: Public Records
Mortgage History
| Date | Status | Borrower | Loan Amount |
|---|---|---|---|
| Previous Owner | Elsner Dale | $25,050 | |
| Previous Owner | Elsner Dale | $196,593 |
Source: Public Records
Tax History Compared to Growth
Tax History
| Year | Tax Paid | Tax Assessment Tax Assessment Total Assessment is a certain percentage of the fair market value that is determined by local assessors to be the total taxable value of land and additions on the property. | Land | Improvement |
|---|---|---|---|---|
| 2024 | $3,330 | $21,666 | $8,749 | $12,917 |
| 2023 | $3,330 | $14,017 | $2,838 | $11,179 |
| 2021 | $3,071 | $14,708 | $3,524 | $11,184 |
| 2020 | $2,920 | $14,708 | $3,524 | $11,184 |
| 2019 | $2,920 | $14,708 | $3,524 | $11,184 |
| 2018 | $2,637 | $12,189 | $2,439 | $9,750 |
| 2017 | $2,622 | $12,189 | $2,439 | $9,750 |
| 2016 | -- | $12,189 | $2,439 | $9,750 |
| 2015 | $2,622 | $12,189 | $2,439 | $9,750 |
| 2014 | $2,534 | $12,189 | $2,439 | $9,750 |
Source: Public Records
Map
Nearby Homes
- 808 Pembridge Ct
- 832 Pembridge Ct
- 904 Bromley Ct
- 311 Highfield Loop
- 347 Castle Dr Unit 1454 BERKSHIRE FORE
- 4529 Weekly Dr
- 224 Castle Dr Unit 1408
- 224 Castle Dr Unit 1402
- 208 Castle Dr Unit 1375
- 208 Castle Dr Unit 1373
- 805 Crumpet Ct Unit 1164
- 1106 Dowling St
- 626 Castle Ct
- 622 Castle Ct
- 318 Castle Dr Unit 1443
- 200 Castle Dr Unit 1366
- 801 Crumpet Ct Unit 1136
- 2775 Eton St
- 804 Crumpet Ct Unit 1151
- 2781 Eton St
- 844 Pembridge Ct Unit Berkshire Forest
- 848 Pembridge Ct
- 840 Pembridge Ct
- 852 Pembridge Ct
- 852 Pembridge Ct Unit Berkshire Forest
- 836 Pembridge Ct
- 812 Pembridge Ct Unit MB
- 804 Pembridge Ct
- 804 Pembridge Ct Unit Berkshire Forest
- 816 Pembridge Ct Unit MB
- 800 Pembridge Ct
- 820 Pembridge Ct Unit MB
- 828 Pembridge Ct
- 824 Pembridge Ct
- 772 Wigston Ct
- 700 Wigston Ct
- 1000 Tayport Ct
- 916 Bromley Ct
- 704 Wigston Ct
- 768 Wigston Ct