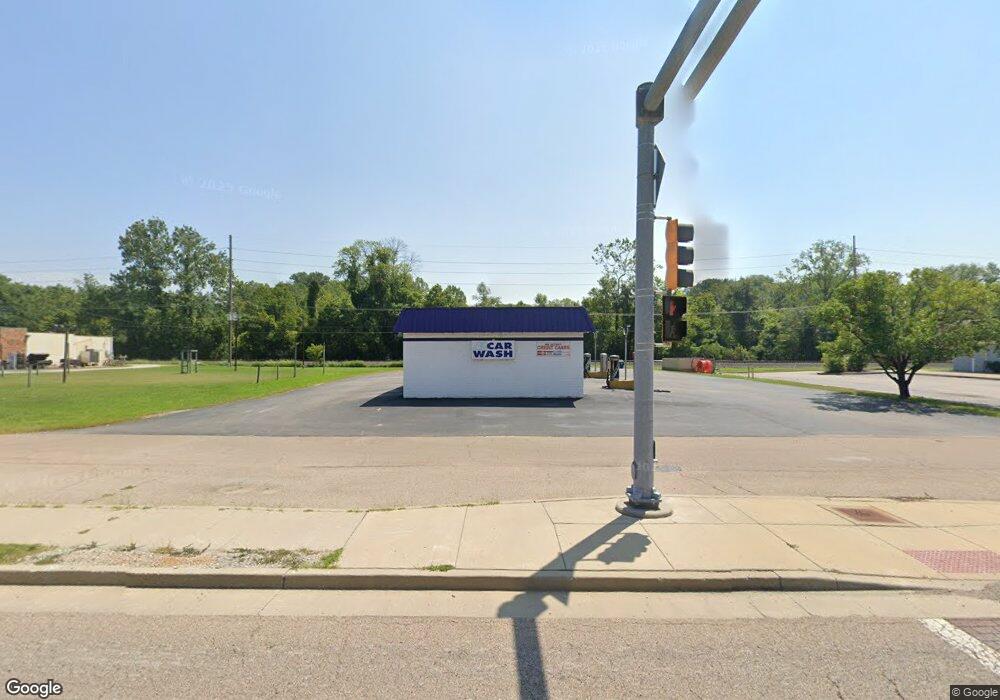
844 S Morrison Ave Collinsville, IL 62234
Studio
--
Bath
3,276
Sq Ft
10,019
Sq Ft Lot Lot
About This Home
This home is located at 844 S Morrison Ave, Collinsville, IL 62234. 844 S Morrison Ave is a home located in Madison County with nearby schools including Twin Echo Elementary School, Dorris Intermediate School, and Collinsville Middle School.
Ownership History
Date
Name
Owned For
Owner Type
Purchase Details
Closed on
Mar 8, 2019
Sold by
844 Land Trust
Bought by
Dhj Holdings Llc Iv
Home Financials for this Owner
Home Financials are based on the most recent Mortgage that was taken out on this home.
Original Mortgage
$126,000
Outstanding Balance
$109,185
Interest Rate
4.4%
Mortgage Type
Construction
Purchase Details
Closed on
Dec 19, 2018
Sold by
Gunawardhana Sarath K
Bought by
844 Land Trust
Purchase Details
Closed on
Mar 30, 2006
Sold by
Meeks Charles E
Bought by
Gunawardhana Sarath K
Home Financials for this Owner
Home Financials are based on the most recent Mortgage that was taken out on this home.
Original Mortgage
$301,688
Interest Rate
7.25%
Mortgage Type
Commercial
Purchase Details
Closed on
Oct 7, 2005
Sold by
Maslosky Betty P
Bought by
Meeks Charles E
Create a Home Valuation Report for This Property
The Home Valuation Report is an in-depth analysis detailing your home's value as well as a comparison with similar homes in the area
Home Values in the Area
Average Home Value in this Area
Purchase History
We collect this data history from publicly available records. To have your information removed, we recommend requesting removal directly through your county’s website.
| Date | Buyer | Sale Price | Title Company |
|---|---|---|---|
| Dhj Holdings Llc Iv | -- | Abstracts & Titles | |
| 844 Land Trust | $35,000 | Abstracts & Titles | |
| Gunawardhana Sarath K | $371,000 | Abstracts & Titles Inc | |
| Meeks Charles E | $250,000 | Abstracts & Titles Inc |
Source: Public Records
Mortgage History
We collect this data history from publicly available records. To have your information removed, we recommend requesting removal directly through your county’s website.
| Date | Status | Borrower | Loan Amount |
|---|---|---|---|
| Open | Dhj Holdings Llc Iv | $126,000 | |
| Previous Owner | Gunawardhana Sarath K | $301,688 |
Source: Public Records
Tax History
| Year | Tax Paid | Tax Assessment Tax Assessment Total Assessment is a certain percentage of the fair market value that is determined by local assessors to be the total taxable value of land and additions on the property. | Land | Improvement |
|---|---|---|---|---|
| 2025 | $2,696 | $45,690 | $10,660 | $35,030 |
| 2024 | $2,696 | $42,170 | $9,840 | $32,330 |
| 2023 | $2,696 | $39,030 | $9,110 | $29,920 |
| 2022 | $2,569 | $36,090 | $8,420 | $27,670 |
| 2021 | $2,317 | $33,540 | $7,980 | $25,560 |
| 2020 | $2,234 | $32,000 | $7,610 | $24,390 |
| 2019 | $2,133 | $30,320 | $7,470 | $22,850 |
| 2018 | $2,085 | $28,720 | $7,070 | $21,650 |
| 2017 | $2,089 | $28,150 | $6,930 | $21,220 |
| 2016 | $2,006 | $25,670 | $6,960 | $18,710 |
| 2015 | $2,158 | $25,000 | $6,780 | $18,220 |
| 2014 | $2,158 | $25,000 | $6,780 | $18,220 |
| 2013 | $2,158 | $28,830 | $6,780 | $22,050 |
Source: Public Records
Map
Nearby Homes
- 1029 Summer Ln
- 912 Dina Ave
- 420 S Seminary St
- 726 Maple St
- 301 Plum St
- 422 S Aurora St
- 403 S Aurora St
- 121 S Seminary St
- Lot 20 Jefferson Ave
- 1109 Saint Clair Ave
- 827 Bond Ave
- Lot 36 Jefferson Ave
- Lot 37 Jefferson Ave
- Lot 32 Jefferson Ave
- Lot 38 Jefferson Ave
- 409 S Jefferson Ave
- 119 N Hesperia St
- 901 W Main St
- 1008 W Main St
- 204 Coral Dr
- 840 S Morrison Ave
- 1003 S Morrison Ave
- 1114 Cherokee St
- 1116 Cherokee St
- 1111 Cherokee St
- 1109 Cherokee St
- 1110 Cherokee St
- 0TBB Idlebrook Dr
- 0 Idlebrook Dr
- 1107 Cherokee St
- 1110 Arrowhead Dr
- 1108 Arrowhead Dr
- 1106 Arrowhead Dr
- 1105 Cherokee St
- 1108 Cherokee St
- 813 S Morrison Ave
- 125 Idlerun Dr
- 1104 Arrowhead Dr Unit B
- 1104 Arrowhead Dr Unit D
- 1104 Arrowhead Dr
Your Personal Tour Guide
Ask me questions while you tour the home.