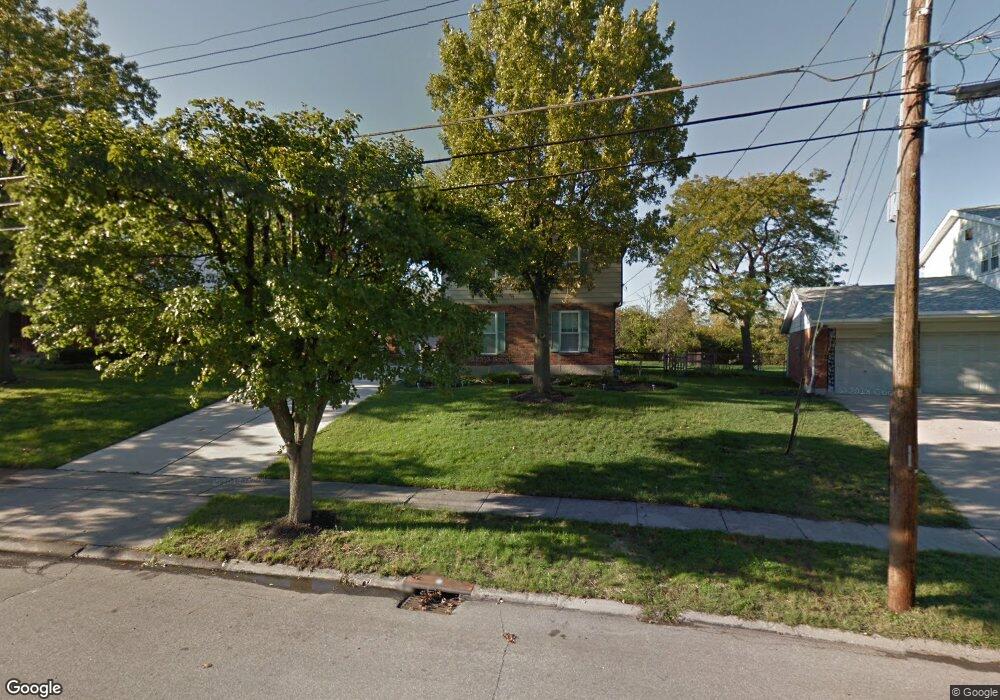
844 Yorkhaven Rd Cincinnati, OH 45240
Estimated Value: $290,540 - $343,000
4
Beds
3
Baths
1,776
Sq Ft
$175/Sq Ft
Est. Value
About This Home
This home is located at 844 Yorkhaven Rd, Cincinnati, OH 45240 and is currently estimated at $311,385, approximately $175 per square foot. 844 Yorkhaven Rd is a home located in Hamilton County with nearby schools including Springdale Elementary School, Princeton Community Middle School, and Princeton High School.
Ownership History
Date
Name
Owned For
Owner Type
Purchase Details
Closed on
Aug 30, 2010
Sold by
Abernathy Holly A and Abernathy Carl P
Bought by
Toler Ii Douglas G and Toler Kari E
Current Estimated Value
Home Financials for this Owner
Home Financials are based on the most recent Mortgage that was taken out on this home.
Original Mortgage
$152,940
Outstanding Balance
$100,013
Interest Rate
4.25%
Mortgage Type
FHA
Estimated Equity
$211,372
Purchase Details
Closed on
Feb 11, 2002
Sold by
Abernathy Holly A
Bought by
Abernathy Carl P and Abernathy Holly A
Home Financials for this Owner
Home Financials are based on the most recent Mortgage that was taken out on this home.
Original Mortgage
$130,400
Interest Rate
6.92%
Create a Home Valuation Report for This Property
The Home Valuation Report is an in-depth analysis detailing your home's value as well as a comparison with similar homes in the area
Home Values in the Area
Average Home Value in this Area
Purchase History
| Date | Buyer | Sale Price | Title Company |
|---|---|---|---|
| Toler Ii Douglas G | $155,000 | Ltoc | |
| Abernathy Carl P | -- | -- |
Source: Public Records
Mortgage History
| Date | Status | Borrower | Loan Amount |
|---|---|---|---|
| Open | Toler Ii Douglas G | $152,940 | |
| Previous Owner | Abernathy Carl P | $130,400 |
Source: Public Records
Tax History
| Year | Tax Paid | Tax Assessment Tax Assessment Total Assessment is a certain percentage of the fair market value that is determined by local assessors to be the total taxable value of land and additions on the property. | Land | Improvement |
|---|---|---|---|---|
| 2025 | $3,761 | $74,960 | $13,626 | $61,334 |
| 2024 | $3,232 | $74,960 | $13,626 | $61,334 |
| 2023 | $3,239 | $74,960 | $13,626 | $61,334 |
| 2022 | $3,050 | $57,408 | $11,414 | $45,994 |
| 2021 | $2,965 | $57,408 | $11,414 | $45,994 |
| 2020 | $3,003 | $57,408 | $11,414 | $45,994 |
| 2019 | $2,778 | $49,067 | $9,755 | $39,312 |
| 2018 | $2,614 | $49,067 | $9,755 | $39,312 |
| 2017 | $2,454 | $49,067 | $9,755 | $39,312 |
| 2016 | $2,569 | $50,996 | $10,189 | $40,807 |
| 2015 | $2,596 | $50,996 | $10,189 | $40,807 |
| 2014 | $2,604 | $50,996 | $10,189 | $40,807 |
| 2013 | $2,709 | $54,251 | $10,840 | $43,411 |
Source: Public Records
Map
Nearby Homes
- 3323 Devonian Dr
- 12069 Cantrell Dr
- 12091 Hitchcock Dr
- 805 Halesworth Dr
- 11839 Hamlet Rd
- 13 Caribou Ct
- 3721 Mack Rd
- 694 Park Ave
- 52 Applewood Dr
- 1000 Olde Station Ct
- 3700 Mack Rd
- 27 Wildwood Dr Unit 179
- 1040 Olde Station Ct
- 15 Applewood Dr
- 126 Chapel Hill Dr Unit 126
- 124 Chapel Hill Dr Unit 124
- 65 Twin Lakes Dr
- 38 Providence Dr
- 96 Twin Lakes Dr
- 784 Farnham Ct
- 848 Yorkhaven Rd
- 840 Yorkhaven Rd
- 849 Clearfield Ln
- 845 Clearfield Ln
- 854 Yorkhaven Rd
- 836 Yorkhaven Rd
- 853 Clearfield Ln
- 841 Clearfield Ln
- 843 Yorkhaven Rd
- 837 Yorkhaven Rd
- 857 Clearfield Ln
- 849 Yorkhaven Rd
- 837 Clearfield Ln
- 860 Yorkhaven Rd
- 832 Yorkhaven Rd
- 831 Yorkhaven Rd
- 855 Yorkhaven Rd
- 12140 Elkridge Dr
- 846 Clearfield Ln
- 833 Clearfield Ln
Your Personal Tour Guide
Ask me questions while you tour the home.