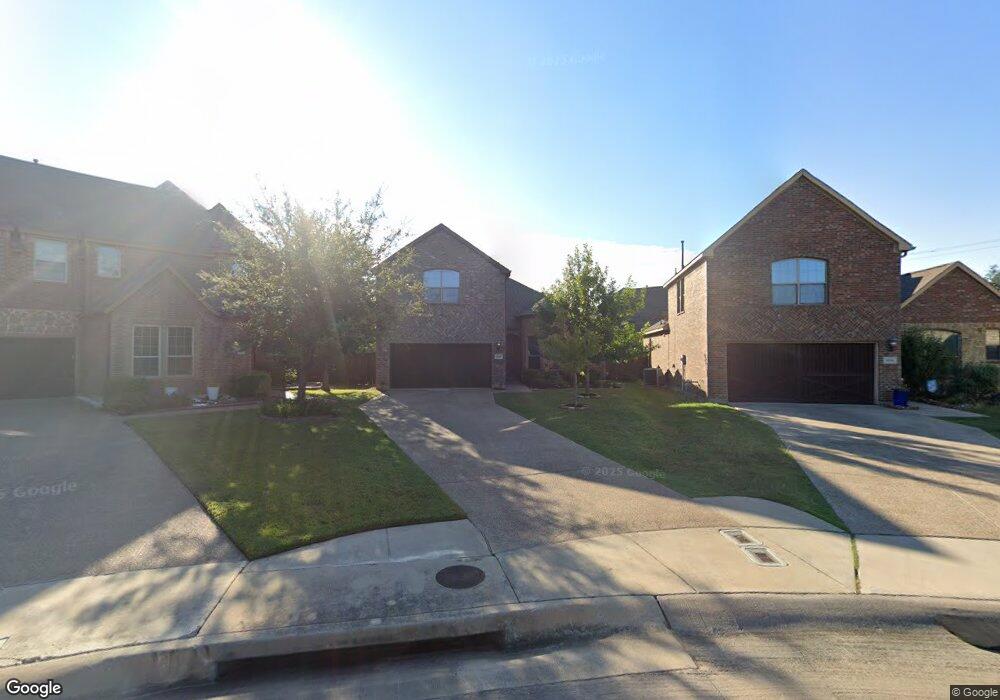
8440 La Fontaine Dr North Richland Hills, TX 76182
Estimated Value: $488,000 - $584,000
4
Beds
3
Baths
2,495
Sq Ft
$219/Sq Ft
Est. Value
About This Home
This home is located at 8440 La Fontaine Dr, North Richland Hills, TX 76182 and is currently estimated at $546,362, approximately $218 per square foot. 8440 La Fontaine Dr is a home located in Tarrant County with nearby schools including Smithfield Elementary School, Smithfield Middle School, and Birdville High School.
Ownership History
Date
Name
Owned For
Owner Type
Purchase Details
Closed on
Jun 27, 2019
Sold by
Sherlock Lee Michael and Sherlock Somi
Bought by
Lamastra Soroya Allyn and Laine Maximilian H
Current Estimated Value
Home Financials for this Owner
Home Financials are based on the most recent Mortgage that was taken out on this home.
Original Mortgage
$331,877
Outstanding Balance
$295,348
Interest Rate
4.62%
Mortgage Type
FHA
Estimated Equity
$251,014
Purchase Details
Closed on
Aug 29, 2012
Sold by
A R Af Inc
Bought by
Sherlock Lee Michael
Home Financials for this Owner
Home Financials are based on the most recent Mortgage that was taken out on this home.
Original Mortgage
$189,364
Interest Rate
3.56%
Mortgage Type
New Conventional
Purchase Details
Closed on
Feb 23, 2011
Sold by
Trinity Distinctive Homes Llc
Bought by
Ray Nowicki Incorporated
Create a Home Valuation Report for This Property
The Home Valuation Report is an in-depth analysis detailing your home's value as well as a comparison with similar homes in the area
Home Values in the Area
Average Home Value in this Area
Purchase History
| Date | Buyer | Sale Price | Title Company |
|---|---|---|---|
| Lamastra Soroya Allyn | -- | Fidelity National | |
| Sherlock Lee Michael | -- | None Available | |
| Ray Nowicki Incorporated | -- | Stnt |
Source: Public Records
Mortgage History
| Date | Status | Borrower | Loan Amount |
|---|---|---|---|
| Open | Lamastra Soroya Allyn | $331,877 | |
| Previous Owner | Sherlock Lee Michael | $189,364 |
Source: Public Records
Tax History Compared to Growth
Tax History
| Year | Tax Paid | Tax Assessment Tax Assessment Total Assessment is a certain percentage of the fair market value that is determined by local assessors to be the total taxable value of land and additions on the property. | Land | Improvement |
|---|---|---|---|---|
| 2025 | $7,961 | $548,351 | $79,772 | $468,579 |
| 2024 | $7,961 | $548,351 | $79,772 | $468,579 |
| 2023 | $9,147 | $472,015 | $79,772 | $392,243 |
| 2022 | $9,122 | $406,705 | $79,772 | $326,933 |
| 2021 | $8,769 | $344,604 | $60,000 | $284,604 |
| 2020 | $8,801 | $345,895 | $60,000 | $285,895 |
| 2019 | $9,143 | $347,185 | $60,000 | $287,185 |
| 2018 | $8,450 | $320,891 | $60,000 | $260,891 |
| 2017 | $8,361 | $310,747 | $60,000 | $250,747 |
| 2016 | $7,559 | $280,947 | $45,000 | $235,947 |
| 2015 | $6,576 | $250,242 | $45,000 | $205,242 |
| 2014 | $6,576 | $244,800 | $40,000 | $204,800 |
Source: Public Records
Map
Nearby Homes
- 8428 Hidden Creek Ct
- 8417 Patricks Path
- 8048 Green Valley Dr
- 7924 Woodland Dr
- 8112 Autumn Run Ln
- 7716 Bridlewood Ct
- 7404 Forrest Ln
- 7924 Ember Oaks Dr
- 8200 Thornhill Dr
- 7901 Forest Point Ct
- 9017 Rumfield Rd
- TBD Kirk Ln
- 8209 Spruce Ct
- 7304 Davis Blvd
- 8505 Scottie St
- 8424 Witt St
- 8229 Forest Glenn
- 7317 Hialeah Cir W
- 7716 Evergreen Ave
- 7216 Everglade Dr
- 8436 La Fontaine Dr
- 8444 La Fontaine Dr
- 8432 La Fontaine Dr
- 8445 La Fontaine Dr
- 8513 Revenue Way
- 8517 Revenue Way
- 8524 Neil Ct
- 8509 Revenue Way
- 8525 Gary Ct
- 8428 La Fontaine Dr
- 8441 La Fontaine Dr
- 8505 Revenue Way
- 8424 La Fontaine Dr
- 8529 Gary Ct
- 8437 La Fontaine Dr
- 8528 Neil Ct
- 8525 Neil Ct
- 8433 La Fontaine Dr
- 8501 Revenue Way
- 7612 Quartering Dr