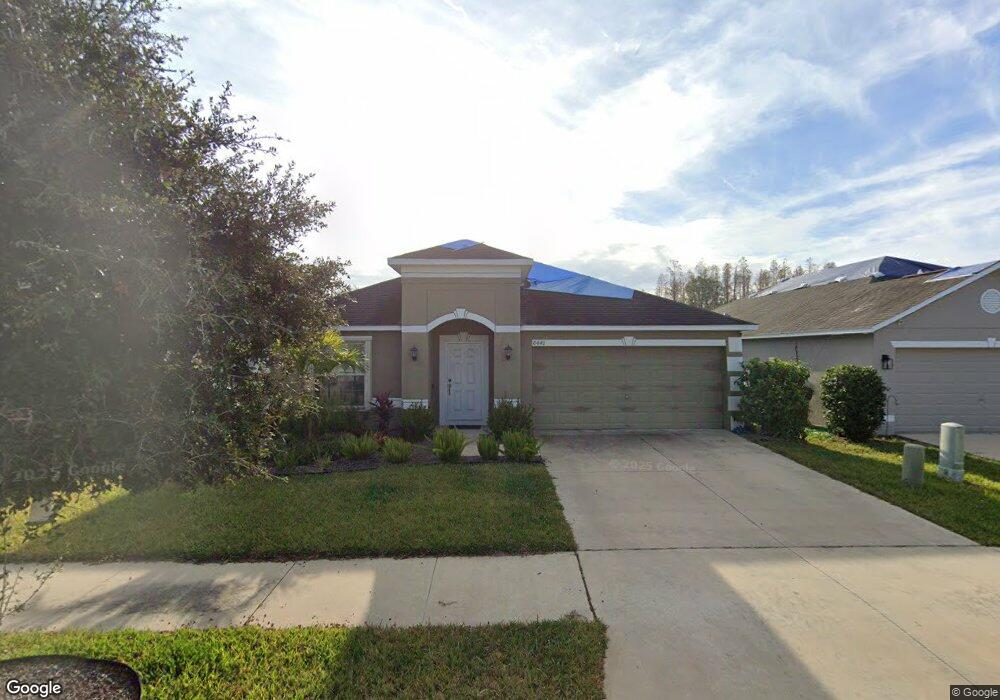
8441 Hunters Fork Loop Unit LOOP Ruskin, FL 33573
Cypress Creek NeighborhoodEstimated Value: $327,000 - $393,000
3
Beds
2
Baths
2,051
Sq Ft
$174/Sq Ft
Est. Value
About This Home
This home is located at 8441 Hunters Fork Loop Unit LOOP, Ruskin, FL 33573 and is currently estimated at $356,052, approximately $173 per square foot. 8441 Hunters Fork Loop Unit LOOP is a home located in Hillsborough County with nearby schools including Cypress Creek Elementary School, Shields Middle School, and Literacy Leadership Technology Academy South Bay.
Ownership History
Date
Name
Owned For
Owner Type
Purchase Details
Closed on
Mar 25, 2022
Sold by
Opendoor Property Trust
Bought by
Willoughby Christopher and Degarmo Heather
Current Estimated Value
Home Financials for this Owner
Home Financials are based on the most recent Mortgage that was taken out on this home.
Original Mortgage
$394,200
Outstanding Balance
$368,473
Interest Rate
4.42%
Mortgage Type
New Conventional
Estimated Equity
-$12,421
Purchase Details
Closed on
Jan 18, 2022
Sold by
Cadick Alice Ann
Bought by
Opendoor Property Trust
Purchase Details
Closed on
Apr 21, 2016
Sold by
Lennar Homes Llc
Bought by
Cadick Alice
Home Financials for this Owner
Home Financials are based on the most recent Mortgage that was taken out on this home.
Original Mortgage
$159,217
Interest Rate
3.73%
Mortgage Type
New Conventional
Create a Home Valuation Report for This Property
The Home Valuation Report is an in-depth analysis detailing your home's value as well as a comparison with similar homes in the area
Home Values in the Area
Average Home Value in this Area
Purchase History
| Date | Buyer | Sale Price | Title Company |
|---|---|---|---|
| Willoughby Christopher | $446,000 | Os National | |
| Opendoor Property Trust | $355,600 | Os National | |
| Cadick Alice | $212,300 | North American Title Company |
Source: Public Records
Mortgage History
| Date | Status | Borrower | Loan Amount |
|---|---|---|---|
| Open | Willoughby Christopher | $394,200 | |
| Previous Owner | Cadick Alice | $159,217 |
Source: Public Records
Tax History
| Year | Tax Paid | Tax Assessment Tax Assessment Total Assessment is a certain percentage of the fair market value that is determined by local assessors to be the total taxable value of land and additions on the property. | Land | Improvement |
|---|---|---|---|---|
| 2025 | $5,948 | $214,914 | -- | -- |
| 2024 | $5,948 | $208,857 | -- | -- |
| 2023 | $5,766 | $202,774 | $0 | $0 |
| 2022 | $5,849 | $217,549 | $0 | $0 |
| 2021 | $5,752 | $211,213 | $0 | $0 |
| 2020 | $5,661 | $208,297 | $34,788 | $173,509 |
| 2019 | $5,723 | $212,939 | $0 | $0 |
| 2018 | $5,401 | $208,969 | $0 | $0 |
| 2017 | $5,596 | $212,711 | $0 | $0 |
| 2016 | $3,126 | $41,112 | $0 | $0 |
| 2015 | $2,366 | $23,656 | $0 | $0 |
| 2014 | $2,192 | $21,505 | $0 | $0 |
| 2013 | -- | $22,080 | $0 | $0 |
Source: Public Records
Map
Nearby Homes
- 8435 Hunters Fork Loop
- 8407 Hunters Fork Loop
- 15530 Long Cypress Dr
- 15303 Long Cypress Dr
- 8406 Cherry Branch Dr
- 15537 Long Cypress Dr
- 15521 Long Cypress Dr
- 15536 Telford Spring Dr
- 15320 Broad Brush Dr
- 15501 Wicked Strong St
- 8130 Alamosa Wood Ave
- 15453 Broad Brush Dr
- 8022 Alamosa Wood Ave
- 4513 Eternal Prince Dr
- 15414 Wicked Strong St
- 15403 Wicked Strong St
- 15419 Shoal Haven Place
- 4457 Eternal Prince Dr
- 7327 Lumber Port Dr
- 15410 Quail Woods Place
- 8441 Hunters Fork Loop
- 8439 Hunters Fork Loop Unit LOOP
- 8503 Hunters Fork Loop
- 8505 Hunters Fork Loop
- 8437 Hunters Fork Loop
- 8507 Hunters Fork Loop
- 15315 Long Cypress Dr
- 8440 Hunters Fork Loop
- 8438 Hunters Fork Loop
- 8502 Hunters Fork Loop
- 8436 Hunters Fork Loop
- 8504 Hunters Fork Loop
- 8433 Hunters Fork Loop
- 8509 Hunters Fork Loop
- 8506 Hunters Fork Loop
- 8434 Hunters Fork Loop
- 8431 Hunters Fork Loop
- 8432 Hunters Fork Loop
- 8508 Hunters Fork Loop
- 8429 Hunters Fork Loop
Your Personal Tour Guide
Ask me questions while you tour the home.