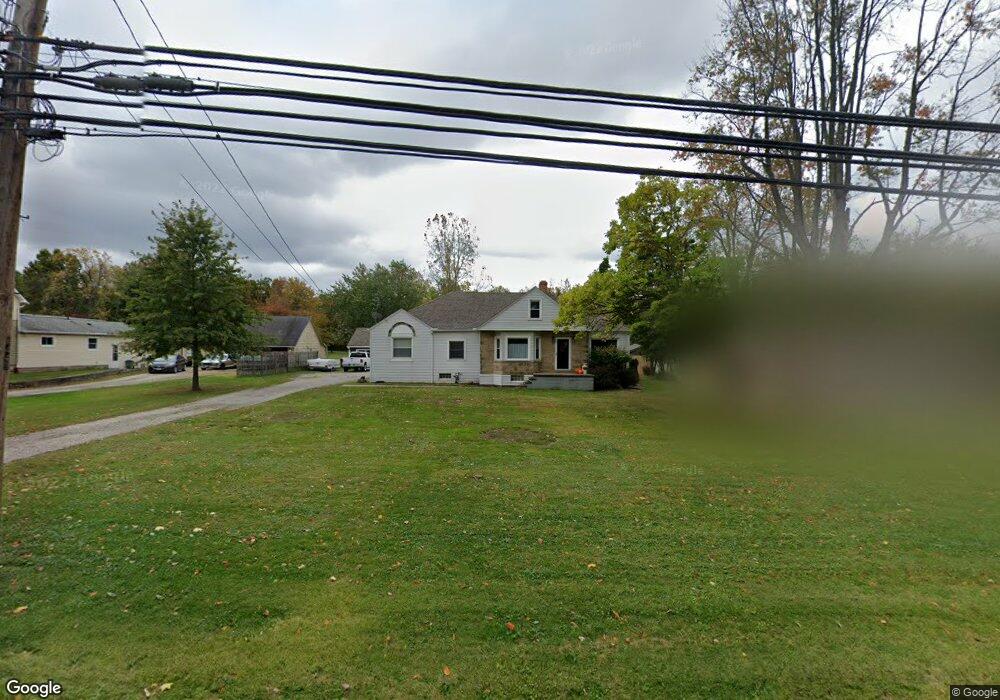
8443 Albion Rd North Royalton, OH 44133
Estimated Value: $324,000 - $381,768
3
Beds
2
Baths
2,066
Sq Ft
$170/Sq Ft
Est. Value
About This Home
This home is located at 8443 Albion Rd, North Royalton, OH 44133 and is currently estimated at $350,442, approximately $169 per square foot. 8443 Albion Rd is a home located in Cuyahoga County with nearby schools including North Royalton Middle School, North Royalton High School, and Saint Albert the Great Roman Catholic School.
Ownership History
Date
Name
Owned For
Owner Type
Purchase Details
Closed on
Apr 8, 2004
Sold by
Gerding Edward A
Bought by
Arko Eric and Arko Melissa A
Current Estimated Value
Home Financials for this Owner
Home Financials are based on the most recent Mortgage that was taken out on this home.
Original Mortgage
$169,000
Outstanding Balance
$79,474
Interest Rate
5.65%
Mortgage Type
Purchase Money Mortgage
Estimated Equity
$270,968
Purchase Details
Closed on
Oct 25, 2003
Sold by
Sadallah George and Sadallah Patricia M
Bought by
Gerding Edward A
Purchase Details
Closed on
Nov 27, 2002
Sold by
Gerding Edward A
Bought by
Sadallah George and Sadallah Patricia M
Purchase Details
Closed on
Mar 12, 1984
Sold by
Gerding Edward A and S M
Bought by
Gerding Edward A
Purchase Details
Closed on
Jan 1, 1975
Bought by
Gerding Edward A and S M
Create a Home Valuation Report for This Property
The Home Valuation Report is an in-depth analysis detailing your home's value as well as a comparison with similar homes in the area
Home Values in the Area
Average Home Value in this Area
Purchase History
| Date | Buyer | Sale Price | Title Company |
|---|---|---|---|
| Arko Eric | $178,000 | U S Title Agency Inc | |
| Gerding Edward A | -- | Lawyers Title Insurance Corp | |
| Sadallah George | $9,500 | Lawyers Title Insurance Corp | |
| Gerding Edward A | -- | -- | |
| Gerding Edward A | -- | -- |
Source: Public Records
Mortgage History
| Date | Status | Borrower | Loan Amount |
|---|---|---|---|
| Open | Arko Eric | $169,000 |
Source: Public Records
Tax History Compared to Growth
Tax History
| Year | Tax Paid | Tax Assessment Tax Assessment Total Assessment is a certain percentage of the fair market value that is determined by local assessors to be the total taxable value of land and additions on the property. | Land | Improvement |
|---|---|---|---|---|
| 2024 | $6,713 | $115,570 | $15,330 | $100,240 |
| 2023 | $4,904 | $77,430 | $18,030 | $59,400 |
| 2022 | $4,871 | $77,420 | $18,030 | $59,400 |
| 2021 | $4,922 | $77,420 | $18,030 | $59,400 |
| 2020 | $4,464 | $66,750 | $15,540 | $51,210 |
| 2019 | $4,109 | $180,800 | $44,400 | $136,400 |
| 2018 | $4,010 | $61,110 | $15,540 | $45,570 |
| 2017 | $3,778 | $54,990 | $15,580 | $39,410 |
| 2016 | $3,540 | $54,990 | $15,580 | $39,410 |
| 2015 | $3,568 | $54,990 | $15,580 | $39,410 |
| 2014 | $3,568 | $54,990 | $15,580 | $39,410 |
Source: Public Records
Map
Nearby Homes
- 11550 York Rd
- 9035 Wallings Rd
- 11658 York Rd
- 9530 Cove Dr Unit C-25
- 9510 Cove Dr Unit C12
- 0 Tilby Rd
- 9912 Lynn Dr
- 9660 Cove Dr Unit F13
- 9630 Cove Dr Unit A-14
- 9611 Sunrise Blvd Unit K2
- 9530 Tilby Rd
- 9581 Tilby Rd
- 9800 Cove Dr Unit H2
- 10641 Albion Rd
- 9761 Sunrise Blvd
- 9821 Sunrise Blvd Unit o1
- 10364 Independence Dr Unit C19
- 10342 Independence Dr Unit 21B
- 9841 Sunrise Blvd Unit P19
- 6451 Glenwillow Dr