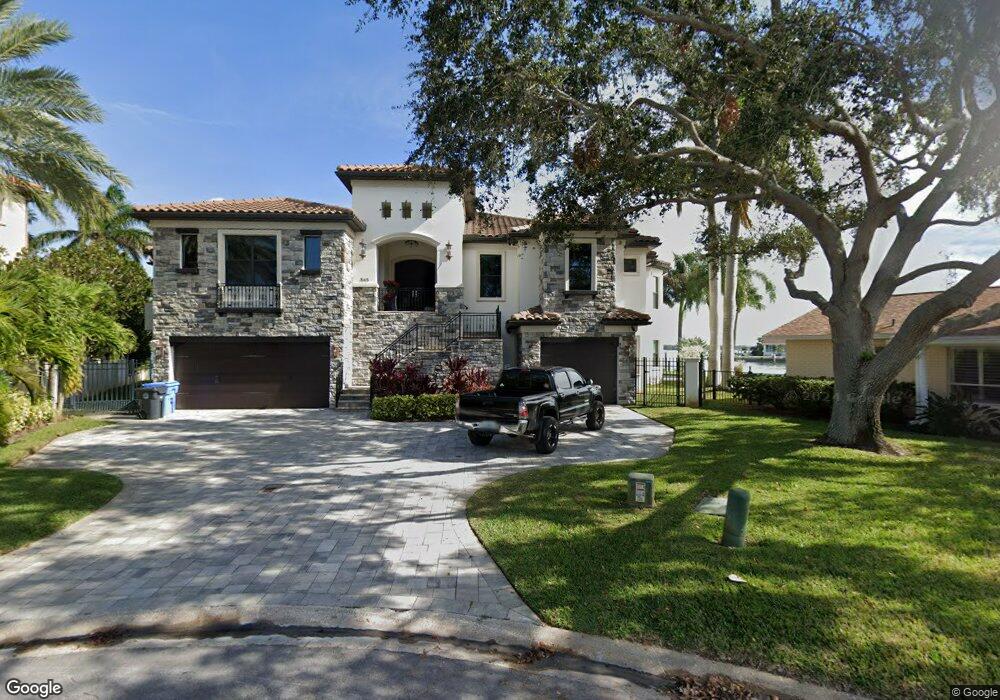
845 116th Ave Treasure Island, FL 33706
Estimated Value: $2,148,000 - $3,559,847
--
Bed
1
Bath
4,220
Sq Ft
$732/Sq Ft
Est. Value
About This Home
This home is located at 845 116th Ave, Treasure Island, FL 33706 and is currently estimated at $3,088,616, approximately $731 per square foot. 845 116th Ave is a home located in Pinellas County with nearby schools including Azalea Elementary School, Azalea Middle School, and Boca Ciega High School.
Ownership History
Date
Name
Owned For
Owner Type
Purchase Details
Closed on
Jan 27, 2009
Sold by
Moore David and Moore Ann Marie
Bought by
Moore David E and Moore Ann Marie
Current Estimated Value
Purchase Details
Closed on
Oct 30, 2006
Sold by
Kraus Elizabeth S
Bought by
Moore David and Moore Ann Marie
Home Financials for this Owner
Home Financials are based on the most recent Mortgage that was taken out on this home.
Original Mortgage
$928,000
Outstanding Balance
$557,823
Interest Rate
6.5%
Mortgage Type
Purchase Money Mortgage
Estimated Equity
$2,530,793
Purchase Details
Closed on
Jun 19, 2003
Sold by
Kraus Edward and Kraus Elizabeth S
Bought by
Kraus Edward and Kraus Elizabeth S
Create a Home Valuation Report for This Property
The Home Valuation Report is an in-depth analysis detailing your home's value as well as a comparison with similar homes in the area
Home Values in the Area
Average Home Value in this Area
Purchase History
| Date | Buyer | Sale Price | Title Company |
|---|---|---|---|
| Moore David E | -- | Attorney | |
| Moore David | $1,160,000 | Multiple | |
| Kraus Edward | -- | -- |
Source: Public Records
Mortgage History
| Date | Status | Borrower | Loan Amount |
|---|---|---|---|
| Open | Moore David | $928,000 |
Source: Public Records
Tax History Compared to Growth
Tax History
| Year | Tax Paid | Tax Assessment Tax Assessment Total Assessment is a certain percentage of the fair market value that is determined by local assessors to be the total taxable value of land and additions on the property. | Land | Improvement |
|---|---|---|---|---|
| 2024 | $22,958 | $1,479,346 | -- | -- |
| 2023 | $22,958 | $1,436,258 | $0 | $0 |
| 2022 | $22,426 | $1,394,425 | $0 | $0 |
| 2021 | $22,883 | $1,353,811 | $0 | $0 |
| 2020 | $22,643 | $1,335,119 | $0 | $0 |
| 2019 | $22,336 | $1,305,102 | $0 | $0 |
| 2018 | $21,888 | $1,280,767 | $0 | $0 |
| 2017 | $21,670 | $1,254,424 | $0 | $0 |
| 2016 | $10,871 | $680,374 | $0 | $0 |
| 2015 | $9,907 | $584,512 | $0 | $0 |
| 2014 | $9,009 | $525,951 | $0 | $0 |
Source: Public Records
Map
Nearby Homes