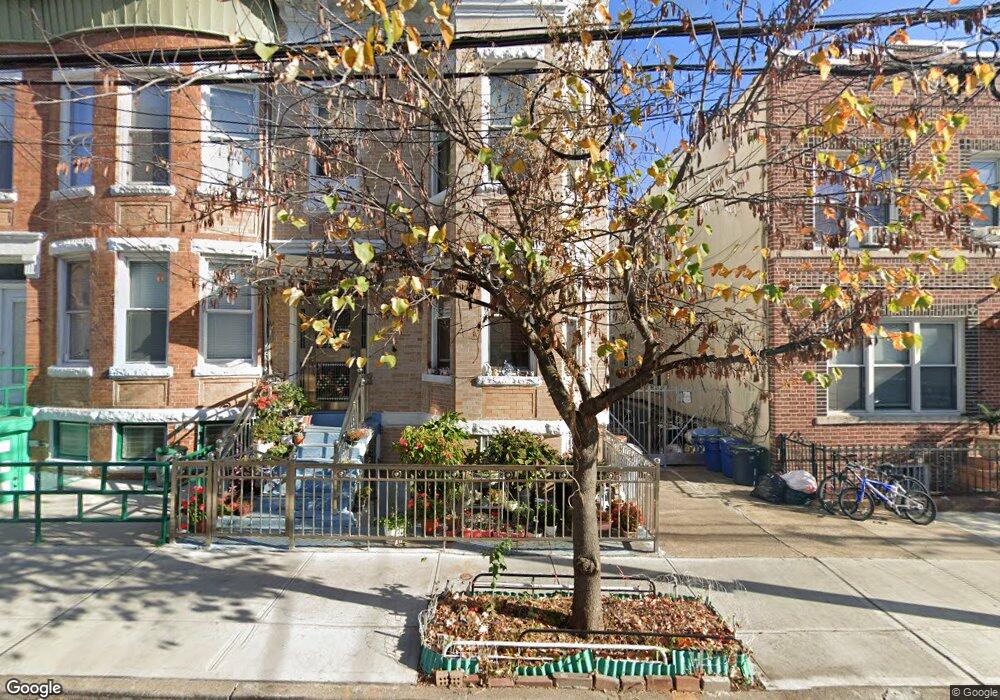
845 41st St Brooklyn, NY 11232
Sunset Park NeighborhoodEstimated Value: $1,322,000 - $1,543,000
Studio
--
Bath
1,912
Sq Ft
$763/Sq Ft
Est. Value
About This Home
This home is located at 845 41st St, Brooklyn, NY 11232 and is currently estimated at $1,458,658, approximately $762 per square foot. 845 41st St is a home located in Kings County with nearby schools including P.S. 169 Sunset Park, I.S. 223 The Montauk, and Shema Kolainu-Hear Our Voices.
Ownership History
Date
Name
Owned For
Owner Type
Purchase Details
Closed on
Jul 30, 2020
Sold by
Tan Yin Zhen and Xu Zhi Heng
Bought by
Xu Barry
Current Estimated Value
Purchase Details
Closed on
Jul 12, 1996
Sold by
Olivieri Itolo and Olivieri Elvira
Bought by
Xu Zhi Heng and Tan Yin Zhen
Home Financials for this Owner
Home Financials are based on the most recent Mortgage that was taken out on this home.
Original Mortgage
$120,000
Interest Rate
7.91%
Mortgage Type
Purchase Money Mortgage
Create a Home Valuation Report for This Property
The Home Valuation Report is an in-depth analysis detailing your home's value as well as a comparison with similar homes in the area
Home Values in the Area
Average Home Value in this Area
Purchase History
| Date | Buyer | Sale Price | Title Company |
|---|---|---|---|
| Xu Barry | -- | -- | |
| Xu Zhi Heng | $232,000 | -- |
Source: Public Records
Mortgage History
| Date | Status | Borrower | Loan Amount |
|---|---|---|---|
| Closed | Xu Zhi Heng | $120,000 |
Source: Public Records
Tax History
| Year | Tax Paid | Tax Assessment Tax Assessment Total Assessment is a certain percentage of the fair market value that is determined by local assessors to be the total taxable value of land and additions on the property. | Land | Improvement |
|---|---|---|---|---|
| 2025 | $6,217 | $85,260 | $26,580 | $58,680 |
| 2024 | $6,217 | $74,520 | $26,580 | $47,940 |
| 2023 | $6,286 | $67,260 | $26,580 | $40,680 |
| 2022 | $3,631 | $59,520 | $26,580 | $32,940 |
| 2021 | $3,602 | $52,860 | $26,580 | $26,280 |
| 2019 | $2,645 | $70,860 | $26,580 | $44,280 |
| 2018 | $4,961 | $25,795 | $7,633 | $18,162 |
| 2017 | $4,910 | $25,557 | $10,522 | $15,035 |
| 2016 | $4,513 | $24,124 | $12,076 | $12,048 |
| 2015 | $2,688 | $22,767 | $10,917 | $11,850 |
| 2014 | $2,688 | $21,496 | $9,940 | $11,556 |
Source: Public Records
Map
Nearby Homes
Your Personal Tour Guide
Ask me questions while you tour the home.