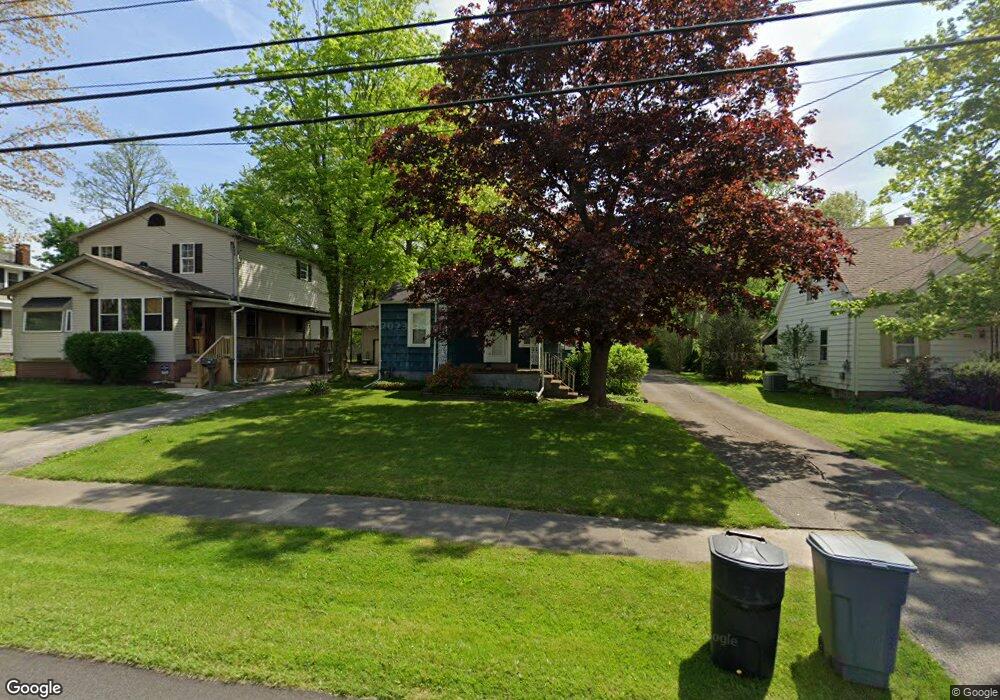
845 Beechwood Dr Girard, OH 44420
Estimated Value: $130,000 - $138,000
3
Beds
1
Bath
1,149
Sq Ft
$116/Sq Ft
Est. Value
About This Home
This home is located at 845 Beechwood Dr, Girard, OH 44420 and is currently estimated at $133,785, approximately $116 per square foot. 845 Beechwood Dr is a home located in Trumbull County with nearby schools including Girard Intermediate School, Prospect Elementary School, and Girard Junior High School.
Ownership History
Date
Name
Owned For
Owner Type
Purchase Details
Closed on
Sep 29, 2006
Sold by
Archer Elsie V and Archer Raymond Ellis
Bought by
Schuchman Jeffrey W
Current Estimated Value
Home Financials for this Owner
Home Financials are based on the most recent Mortgage that was taken out on this home.
Original Mortgage
$48,000
Outstanding Balance
$28,832
Interest Rate
6.58%
Mortgage Type
New Conventional
Estimated Equity
$104,953
Purchase Details
Closed on
Sep 19, 2006
Sold by
Archer Elsie V and Archer Raymond Ellis
Bought by
Schuchman Jeffrey W
Home Financials for this Owner
Home Financials are based on the most recent Mortgage that was taken out on this home.
Original Mortgage
$48,000
Outstanding Balance
$28,832
Interest Rate
6.58%
Mortgage Type
New Conventional
Estimated Equity
$104,953
Purchase Details
Closed on
Jan 1, 1990
Sold by
Archer Chas E
Bought by
Elsie V Archer
Create a Home Valuation Report for This Property
The Home Valuation Report is an in-depth analysis detailing your home's value as well as a comparison with similar homes in the area
Home Values in the Area
Average Home Value in this Area
Purchase History
| Date | Buyer | Sale Price | Title Company |
|---|---|---|---|
| Schuchman Jeffrey W | $60,000 | None Available | |
| Schuchman Jeffrey W | $60,000 | None Available | |
| Elsie V Archer | -- | -- |
Source: Public Records
Mortgage History
| Date | Status | Borrower | Loan Amount |
|---|---|---|---|
| Open | Schuchman Jeffrey W | $48,000 | |
| Closed | Schuchman Jeffrey W | $48,000 |
Source: Public Records
Tax History Compared to Growth
Tax History
| Year | Tax Paid | Tax Assessment Tax Assessment Total Assessment is a certain percentage of the fair market value that is determined by local assessors to be the total taxable value of land and additions on the property. | Land | Improvement |
|---|---|---|---|---|
| 2024 | $1,214 | $29,300 | $4,940 | $24,360 |
| 2023 | $1,214 | $29,300 | $4,940 | $24,360 |
| 2022 | $974 | $18,630 | $4,940 | $13,690 |
| 2021 | $977 | $18,630 | $4,940 | $13,690 |
| 2020 | $990 | $18,630 | $4,940 | $13,690 |
| 2019 | $976 | $17,370 | $4,940 | $12,430 |
| 2018 | $1,023 | $17,370 | $4,940 | $12,430 |
| 2017 | $1,019 | $17,370 | $4,940 | $12,430 |
| 2016 | $902 | $14,810 | $4,900 | $9,910 |
| 2015 | $892 | $14,810 | $4,900 | $9,910 |
| 2014 | $892 | $14,810 | $4,900 | $9,910 |
| 2013 | $926 | $15,680 | $4,900 | $10,780 |
Source: Public Records
Map
Nearby Homes
- 943 Dravis St
- 837 Pinecrest Rd
- 451 Powers Ave
- 445 Powers Ave
- 822 Golf Ave
- 995 Keefer Rd
- 349 Forsythe Ave
- 1405 Red Oak Dr
- 1104 Gary Ave
- 843 Lawrence Ave
- 634 Goist Ln
- 238 E Main St
- 920 Washington Ave
- 216 E Main St
- 149 Churchill Rd
- 200 E Main St
- 126 Churchill Rd
- 111 Churchill Rd
- 1050 Park Cir
- 414 Parkview Dr
- 839 Beechwood Dr
- 853 Beechwood Dr
- 831 Beechwood Dr
- 849 Beechwood Dr
- 859 Beechwood Dr
- 844 Beechwood Dr
- 850 Beechwood Dr
- 838 Beechwood Dr
- 863 Beechwood Dr
- 838 Beechwood Ave
- 856 Beechwood Dr
- 862 Dravis St
- 832 Beechwood Dr
- 862 Beechwood Dr
- 815 Beechwood Dr
- 824 Beechwood Dr
- 868 Beechwood Dr
- 843 Woodlawn Ave
- 849 Woodlawn Ave
- 835 Woodlawn Ave