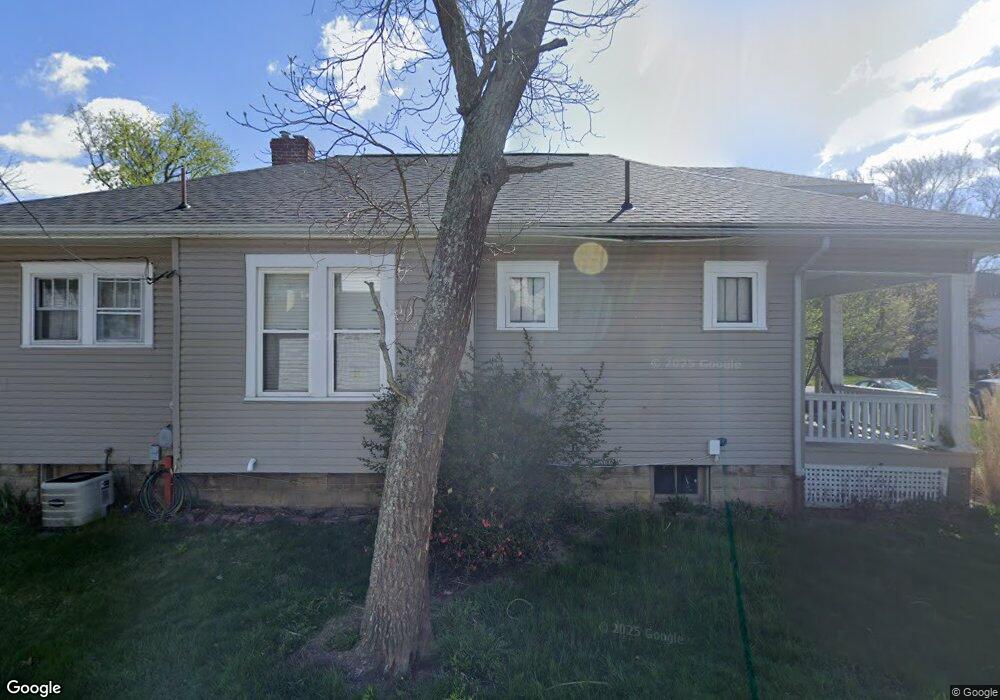
845 Locust Ave Zanesville, OH 43701
Estimated Value: $155,000 - $205,000
2
Beds
1
Bath
1,240
Sq Ft
$147/Sq Ft
Est. Value
About This Home
This home is located at 845 Locust Ave, Zanesville, OH 43701 and is currently estimated at $181,896, approximately $146 per square foot. 845 Locust Ave is a home located in Muskingum County with nearby schools including John McIntire Elementary School, Zanesville Middle School, and Zanesville High School.
Ownership History
Date
Name
Owned For
Owner Type
Purchase Details
Closed on
Oct 14, 2009
Sold by
Winland Martin J
Bought by
Mccullough Ian W and Mccullough Courtney D
Current Estimated Value
Home Financials for this Owner
Home Financials are based on the most recent Mortgage that was taken out on this home.
Original Mortgage
$100,107
Outstanding Balance
$65,601
Interest Rate
5.15%
Mortgage Type
VA
Estimated Equity
$116,295
Purchase Details
Closed on
May 26, 2004
Sold by
Sims Jeffrey A
Bought by
Winland Martin J
Home Financials for this Owner
Home Financials are based on the most recent Mortgage that was taken out on this home.
Original Mortgage
$65,700
Interest Rate
5.5%
Mortgage Type
Purchase Money Mortgage
Purchase Details
Closed on
Mar 10, 2000
Sold by
Deaver Alice
Bought by
Sims Jeffrey A
Home Financials for this Owner
Home Financials are based on the most recent Mortgage that was taken out on this home.
Original Mortgage
$54,387
Interest Rate
8.26%
Mortgage Type
New Conventional
Create a Home Valuation Report for This Property
The Home Valuation Report is an in-depth analysis detailing your home's value as well as a comparison with similar homes in the area
Home Values in the Area
Average Home Value in this Area
Purchase History
| Date | Buyer | Sale Price | Title Company |
|---|---|---|---|
| Mccullough Ian W | $98,000 | Attorney | |
| Winland Martin J | $73,000 | -- | |
| Sims Jeffrey A | $57,250 | -- |
Source: Public Records
Mortgage History
| Date | Status | Borrower | Loan Amount |
|---|---|---|---|
| Open | Mccullough Ian W | $100,107 | |
| Closed | Winland Martin J | $65,700 | |
| Previous Owner | Sims Jeffrey A | $54,387 |
Source: Public Records
Tax History Compared to Growth
Tax History
| Year | Tax Paid | Tax Assessment Tax Assessment Total Assessment is a certain percentage of the fair market value that is determined by local assessors to be the total taxable value of land and additions on the property. | Land | Improvement |
|---|---|---|---|---|
| 2024 | $1,338 | $36,855 | $6,510 | $30,345 |
| 2023 | $1,136 | $29,295 | $4,865 | $24,430 |
| 2022 | $1,116 | $29,295 | $4,865 | $24,430 |
| 2021 | $1,107 | $29,295 | $4,865 | $24,430 |
| 2020 | $1,033 | $26,635 | $4,410 | $22,225 |
| 2019 | $1,032 | $26,635 | $4,410 | $22,225 |
| 2018 | $1,047 | $26,635 | $4,410 | $22,225 |
| 2017 | $933 | $22,785 | $4,445 | $18,340 |
| 2016 | $947 | $22,790 | $4,450 | $18,340 |
| 2015 | $949 | $22,790 | $4,450 | $18,340 |
| 2013 | $1,055 | $22,790 | $4,450 | $18,340 |
Source: Public Records
Map
Nearby Homes
- 1516 Myrtle Ave
- 720 Locust Ave
- 1630 Marion Ave
- 641 Fairmont Ave
- 714 Saint Louis Ave
- 933 Adair Ave
- 955 Adair Ave
- 626 Saint Louis Ave
- 839 Brown St
- 1019 Adair Ave
- 1251 Marwood Dr
- 513 Van Horn Ave
- 919 Sunset Ave
- 1430 Euclid Ave
- 1119 Abbey Place
- 2036 Marion Ave
- 1137 Roosevelt Ave
- 1435 Bluff St
- 370 Sheridan St
- 1968 Dresden Rd