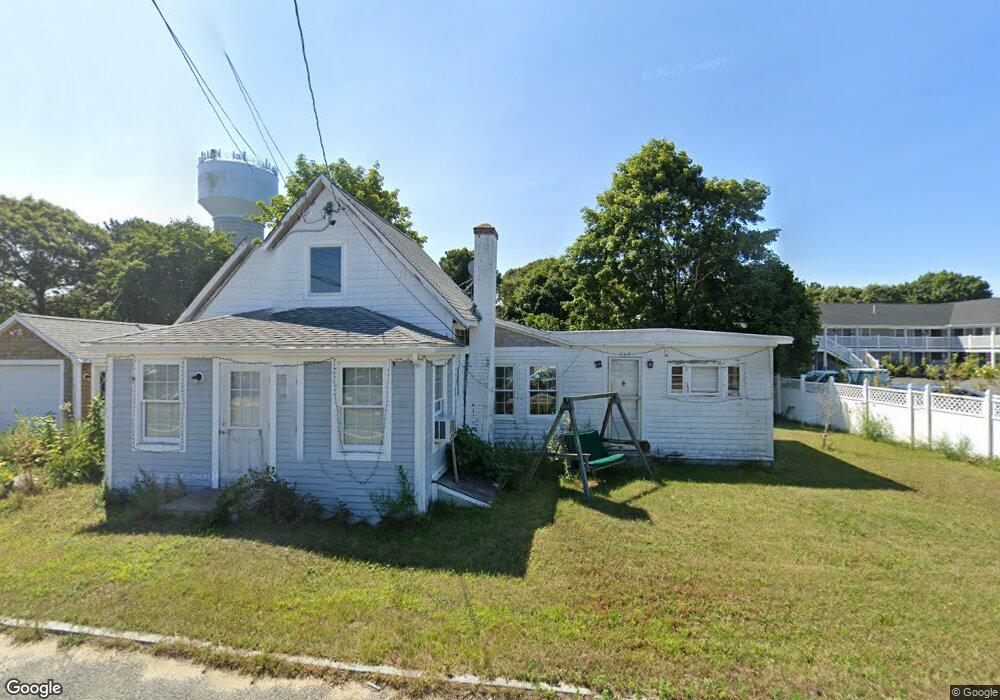
845 Main St West Dennis, MA 02670
West Dennis NeighborhoodEstimated Value: $494,000 - $946,000
4
Beds
2
Baths
2,037
Sq Ft
$378/Sq Ft
Est. Value
About This Home
This home is located at 845 Main St, West Dennis, MA 02670 and is currently estimated at $770,052, approximately $378 per square foot. 845 Main St is a home located in Barnstable County with nearby schools including Dennis-Yarmouth Regional High School and St. Pius X. School.
Ownership History
Date
Name
Owned For
Owner Type
Purchase Details
Closed on
Sep 18, 2009
Sold by
Soderstrom Christian A
Bought by
Obrien John J
Current Estimated Value
Purchase Details
Closed on
Jan 7, 2000
Sold by
841 Main Street T
Bought by
Soderstrom Christian A
Create a Home Valuation Report for This Property
The Home Valuation Report is an in-depth analysis detailing your home's value as well as a comparison with similar homes in the area
Home Values in the Area
Average Home Value in this Area
Purchase History
| Date | Buyer | Sale Price | Title Company |
|---|---|---|---|
| Obrien John J | $195,000 | -- | |
| Soderstrom Christian A | $150,000 | -- |
Source: Public Records
Tax History Compared to Growth
Tax History
| Year | Tax Paid | Tax Assessment Tax Assessment Total Assessment is a certain percentage of the fair market value that is determined by local assessors to be the total taxable value of land and additions on the property. | Land | Improvement |
|---|---|---|---|---|
| 2025 | $2,254 | $520,500 | $257,100 | $263,400 |
| 2024 | $2,189 | $498,700 | $247,300 | $251,400 |
| 2023 | $2,120 | $453,900 | $224,800 | $229,100 |
| 2022 | $2,095 | $374,100 | $202,500 | $171,600 |
| 2021 | $7,585 | $353,000 | $198,500 | $154,500 |
| 2020 | $7,553 | $351,200 | $198,500 | $152,700 |
| 2019 | $2,276 | $368,900 | $212,300 | $156,600 |
| 2018 | $7,583 | $338,200 | $202,100 | $136,100 |
| 2017 | $2,600 | $325,800 | $185,300 | $140,500 |
| 2016 | $2,165 | $331,500 | $210,500 | $121,000 |
| 2015 | $2,122 | $331,500 | $210,500 | $121,000 |
| 2014 | $1,969 | $310,000 | $185,300 | $124,700 |
Source: Public Records
Map
Nearby Homes