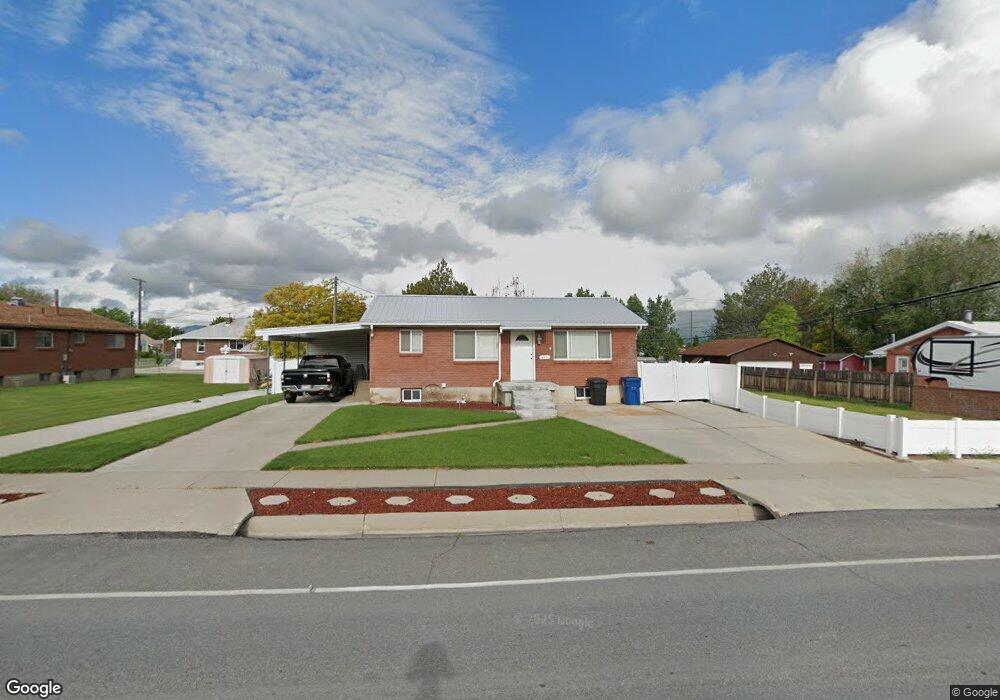
845 N 400 E Spanish Fork, UT 84660
Estimated Value: $395,000 - $433,787
3
Beds
2
Baths
1,872
Sq Ft
$221/Sq Ft
Est. Value
About This Home
This home is located at 845 N 400 E, Spanish Fork, UT 84660 and is currently estimated at $413,262, approximately $220 per square foot. 845 N 400 E is a home located in Utah County with nearby schools including Park Elementary School, Spanish Fork Jr High School, and Spanish Fork High School.
Ownership History
Date
Name
Owned For
Owner Type
Purchase Details
Closed on
Feb 12, 2026
Sold by
Bahr Howard M and Bahr Kathleen S
Bought by
Bahr Family Trust and Bahr
Current Estimated Value
Purchase Details
Closed on
Aug 26, 2013
Sold by
Brown Ronald C and Brown Marilyn K
Bought by
Bahr Howard M and Bahr Kathleen S
Home Financials for this Owner
Home Financials are based on the most recent Mortgage that was taken out on this home.
Original Mortgage
$116,200
Interest Rate
4.27%
Mortgage Type
New Conventional
Create a Home Valuation Report for This Property
The Home Valuation Report is an in-depth analysis detailing your home's value as well as a comparison with similar homes in the area
Home Values in the Area
Average Home Value in this Area
Purchase History
| Date | Buyer | Sale Price | Title Company |
|---|---|---|---|
| Bahr Family Trust | -- | None Listed On Document | |
| Bahr Howard M | -- | Keystone Title Insurance Ag |
Source: Public Records
Mortgage History
| Date | Status | Borrower | Loan Amount |
|---|---|---|---|
| Previous Owner | Bahr Howard M | $116,200 |
Source: Public Records
Tax History
| Year | Tax Paid | Tax Assessment Tax Assessment Total Assessment is a certain percentage of the fair market value that is determined by local assessors to be the total taxable value of land and additions on the property. | Land | Improvement |
|---|---|---|---|---|
| 2025 | $1,902 | $212,300 | -- | -- |
| 2024 | $1,902 | $196,020 | $0 | $0 |
| 2023 | $1,912 | $197,340 | $0 | $0 |
| 2022 | $1,987 | $201,135 | $0 | $0 |
| 2021 | $1,743 | $282,200 | $79,100 | $203,100 |
| 2020 | $1,581 | $248,900 | $65,900 | $183,000 |
| 2019 | $1,370 | $226,900 | $65,900 | $161,000 |
| 2018 | $1,286 | $205,900 | $65,900 | $140,000 |
| 2017 | $1,161 | $99,935 | $0 | $0 |
| 2016 | $1,020 | $86,625 | $0 | $0 |
| 2015 | $957 | $80,300 | $0 | $0 |
| 2014 | $874 | $73,590 | $0 | $0 |
Source: Public Records
Map
Nearby Homes
Your Personal Tour Guide
Ask me questions while you tour the home.