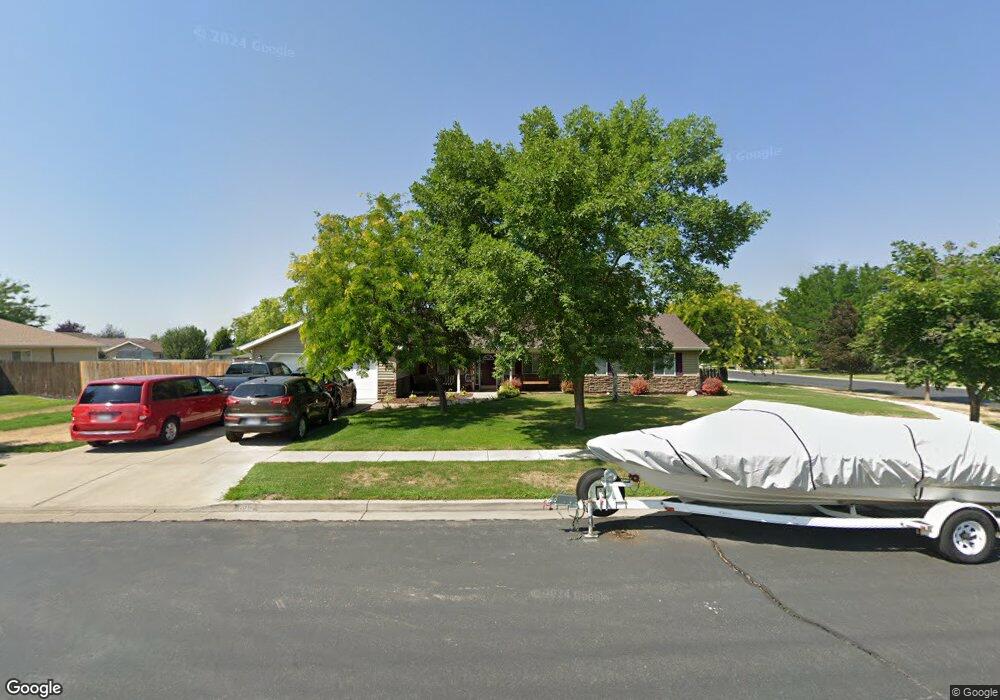
845 W 2770 S Nibley, UT 84321
Estimated Value: $445,000 - $496,000
4
Beds
2
Baths
1,819
Sq Ft
$255/Sq Ft
Est. Value
About This Home
This home is located at 845 W 2770 S, Nibley, UT 84321 and is currently estimated at $464,579, approximately $255 per square foot. 845 W 2770 S is a home located in Cache County with nearby schools including Nibley School, Spring Creek Middle School, and South Cache Middle School.
Ownership History
Date
Name
Owned For
Owner Type
Purchase Details
Closed on
Oct 3, 2017
Sold by
Hayden John E and Hayden Haley S
Bought by
Hayden Connie and Hayden George
Current Estimated Value
Purchase Details
Closed on
Apr 24, 2012
Sold by
Adamson Lanee Bradford and Adamson Chelsea Anne
Bought by
Hayden John E and Hayden Haley S
Home Financials for this Owner
Home Financials are based on the most recent Mortgage that was taken out on this home.
Original Mortgage
$173,000
Outstanding Balance
$119,235
Interest Rate
3.94%
Mortgage Type
New Conventional
Estimated Equity
$345,344
Purchase Details
Closed on
Feb 25, 2009
Sold by
Adamson Chelsea Anne and Adamson Lanee Bradford
Bought by
Adamson Lanee Bradford and Adamson Chelsea Anne
Home Financials for this Owner
Home Financials are based on the most recent Mortgage that was taken out on this home.
Original Mortgage
$140,000
Interest Rate
4.91%
Mortgage Type
New Conventional
Create a Home Valuation Report for This Property
The Home Valuation Report is an in-depth analysis detailing your home's value as well as a comparison with similar homes in the area
Home Values in the Area
Average Home Value in this Area
Purchase History
| Date | Buyer | Sale Price | Title Company |
|---|---|---|---|
| Hayden Connie | -- | -- | |
| Hayden John E | -- | American Secure Title Logan | |
| Adamson Lanee Bradford | -- | Northern Title Company |
Source: Public Records
Mortgage History
| Date | Status | Borrower | Loan Amount |
|---|---|---|---|
| Open | Hayden John E | $173,000 | |
| Previous Owner | Adamson Lanee Bradford | $140,000 |
Source: Public Records
Tax History Compared to Growth
Tax History
| Year | Tax Paid | Tax Assessment Tax Assessment Total Assessment is a certain percentage of the fair market value that is determined by local assessors to be the total taxable value of land and additions on the property. | Land | Improvement |
|---|---|---|---|---|
| 2025 | $1,669 | $221,190 | $0 | $0 |
| 2024 | $1,781 | $221,665 | $0 | $0 |
| 2023 | $1,865 | $217,300 | $0 | $0 |
| 2022 | $1,941 | $217,300 | $0 | $0 |
| 2021 | $1,893 | $329,075 | $65,000 | $264,075 |
| 2020 | $1,461 | $241,847 | $65,000 | $176,847 |
| 2019 | $1,532 | $241,847 | $65,000 | $176,847 |
| 2018 | $1,291 | $198,780 | $45,000 | $153,780 |
| 2017 | $1,246 | $101,640 | $0 | $0 |
| 2016 | $1,260 | $101,640 | $0 | $0 |
| 2015 | $1,103 | $89,540 | $0 | $0 |
| 2014 | $1,078 | $89,540 | $0 | $0 |
| 2013 | -- | $89,540 | $0 | $0 |
Source: Public Records
Map
Nearby Homes