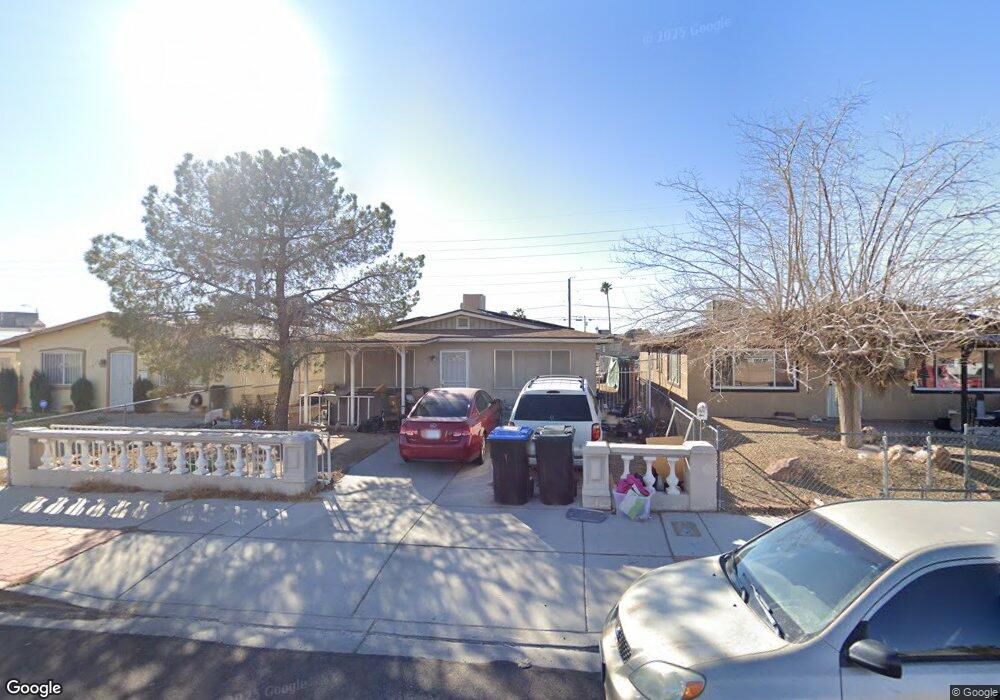
845 W Carey Ave North Las Vegas, NV 89030
West Las Vegas NeighborhoodEstimated Value: $287,000 - $314,000
4
Beds
2
Baths
1,320
Sq Ft
$230/Sq Ft
Est. Value
About This Home
This home is located at 845 W Carey Ave, North Las Vegas, NV 89030 and is currently estimated at $303,573, approximately $229 per square foot. 845 W Carey Ave is a home located in Clark County with nearby schools including H.P. Fitzgerald Elementary School, West Prepatory Academy At Charlles I West Hall Sec, and Canyon Springs High School And The Leadership And.
Ownership History
Date
Name
Owned For
Owner Type
Purchase Details
Closed on
Nov 13, 2003
Sold by
Garnett Marilyn W and Mendez Anthony R
Bought by
Garnett Marilyn Williams
Current Estimated Value
Home Financials for this Owner
Home Financials are based on the most recent Mortgage that was taken out on this home.
Original Mortgage
$75,650
Outstanding Balance
$38,320
Interest Rate
7.35%
Mortgage Type
Unknown
Estimated Equity
$265,253
Purchase Details
Closed on
Dec 18, 2001
Sold by
Willacey Lela M and Hendy Elton
Bought by
Garnett Marilyn W and Mendez Anthony R
Purchase Details
Closed on
Feb 14, 2001
Sold by
Willacey Francine Lela and Willacey James N
Bought by
Willacey Lela M and Hendy Elton
Purchase Details
Closed on
Aug 10, 1994
Sold by
Willacey Francine Lela
Bought by
Willacey James Nathaniel and Willacey Francine Lela
Home Financials for this Owner
Home Financials are based on the most recent Mortgage that was taken out on this home.
Original Mortgage
$31,800
Interest Rate
8.65%
Create a Home Valuation Report for This Property
The Home Valuation Report is an in-depth analysis detailing your home's value as well as a comparison with similar homes in the area
Home Values in the Area
Average Home Value in this Area
Purchase History
| Date | Buyer | Sale Price | Title Company |
|---|---|---|---|
| Garnett Marilyn Williams | -- | Fidelity National Title | |
| Garnett Marilyn W | $80,000 | -- | |
| Willacey Lela M | $80,000 | -- | |
| Willacey James Nathaniel | -- | Nevada Title Company |
Source: Public Records
Mortgage History
| Date | Status | Borrower | Loan Amount |
|---|---|---|---|
| Open | Garnett Marilyn Williams | $75,650 | |
| Previous Owner | Willacey James Nathaniel | $31,800 |
Source: Public Records
Tax History Compared to Growth
Tax History
| Year | Tax Paid | Tax Assessment Tax Assessment Total Assessment is a certain percentage of the fair market value that is determined by local assessors to be the total taxable value of land and additions on the property. | Land | Improvement |
|---|---|---|---|---|
| 2025 | $485 | $27,718 | $13,125 | $14,593 |
| 2024 | $450 | $27,718 | $13,125 | $14,593 |
| 2023 | $450 | $26,350 | $13,125 | $13,225 |
| 2022 | $417 | $24,790 | $13,005 | $11,785 |
| 2021 | $386 | $20,815 | $9,844 | $10,971 |
| 2020 | $356 | $21,154 | $9,844 | $11,310 |
| 2019 | $333 | $19,180 | $7,656 | $11,524 |
| 2018 | $322 | $18,778 | $7,438 | $11,340 |
| 2017 | $602 | $18,367 | $6,563 | $11,804 |
| 2016 | $303 | $16,768 | $4,200 | $12,568 |
| 2015 | $301 | $15,350 | $2,625 | $12,725 |
| 2014 | $292 | $12,884 | $2,625 | $10,259 |
Source: Public Records
Map
Nearby Homes
- 2419 Country Orchard St
- 725 Miller Ave
- 1105 Boylston Ave
- 2408 Copperbelt St
- 1120 Boylston Ave
- 2405 Copperbelt St
- 1108 Boylston Ave
- 1112 Boylston Ave
- 2409 Copperbelt St
- 2413 Copperbelt St
- 1116 Boylston Ave
- 2232 Matheson St
- 844 Balzar Ave
- 952 Balzar Ave
- 624 Desert Senna Ave
- 916 Carey Grove Ave Unit 2
- 2130 Revere St
- 729 van Ert Ave
- 0 Miller Steet
- 0 Miller Streeet
- 839 W Carey Ave
- 833 W Carey Ave
- 857 W Carey Ave
- 863 W Carey Ave
- 850 Miller Ave Unit 4
- 838 Miller Ave
- 869 W Carey Ave
- 832 Miller Ave
- 826 Miller Ave
- 860 Miller Ave
- 875 W Carey Ave
- 875 W Carey Ave
- 820 Miller Ave
- 821 Camden Yard Ct
- 817 Camden Yard Ct
- 881 W Carey Ave
- 825 Camden Yard Ct
- 810 Miller Ave
- 881 W Carey Ave