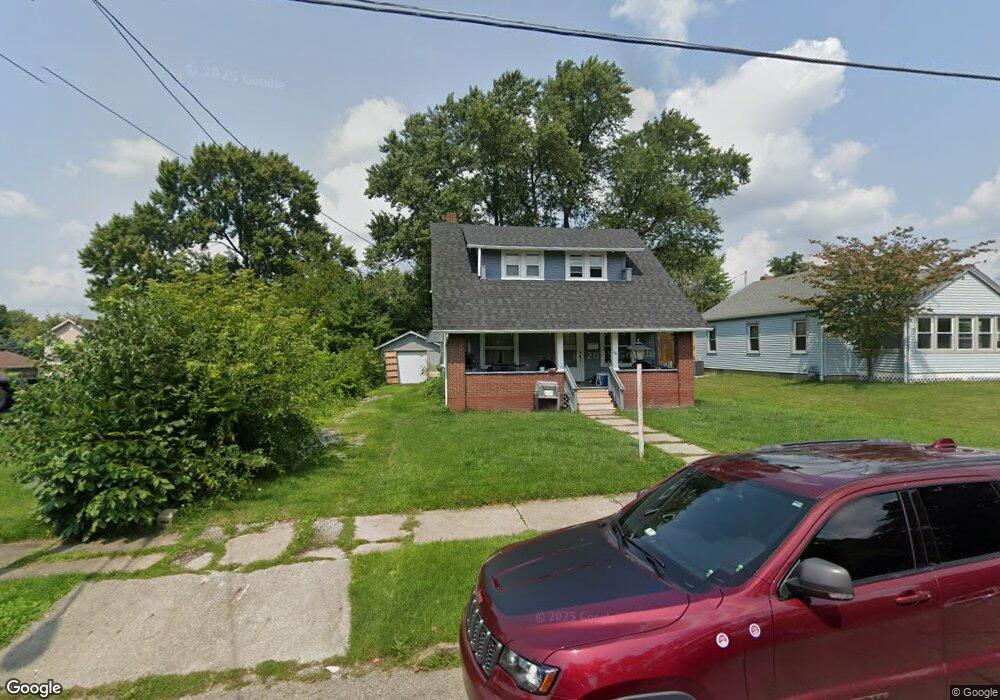
845 W College Rd Alliance, OH 44601
Estimated Value: $127,000 - $179,000
4
Beds
1
Bath
1,708
Sq Ft
$88/Sq Ft
Est. Value
About This Home
This home is located at 845 W College Rd, Alliance, OH 44601 and is currently estimated at $149,466, approximately $87 per square foot. 845 W College Rd is a home located in Stark County with nearby schools including Alliance Early Learning School, Alliance Intermediate School at Northside, and Alliance Middle School.
Ownership History
Date
Name
Owned For
Owner Type
Purchase Details
Closed on
Sep 21, 2021
Sold by
Edge Properties And Investments Llc
Bought by
Bisono Johnathan A
Current Estimated Value
Home Financials for this Owner
Home Financials are based on the most recent Mortgage that was taken out on this home.
Original Mortgage
$93,279
Outstanding Balance
$84,877
Interest Rate
2.8%
Mortgage Type
FHA
Estimated Equity
$64,589
Purchase Details
Closed on
May 9, 2016
Sold by
Spires David R
Bought by
Edge Properties And Investments Llc
Purchase Details
Closed on
Oct 30, 2015
Sold by
Zamagias Stephen M and Zamagias Norma J
Bought by
Spires David R
Home Financials for this Owner
Home Financials are based on the most recent Mortgage that was taken out on this home.
Original Mortgage
$43,500
Interest Rate
3.82%
Mortgage Type
New Conventional
Create a Home Valuation Report for This Property
The Home Valuation Report is an in-depth analysis detailing your home's value as well as a comparison with similar homes in the area
Home Values in the Area
Average Home Value in this Area
Purchase History
| Date | Buyer | Sale Price | Title Company |
|---|---|---|---|
| Bisono Johnathan A | $95,000 | None Available | |
| Edge Properties And Investments Llc | -- | None Available | |
| Spires David R | $58,000 | Attorney |
Source: Public Records
Mortgage History
| Date | Status | Borrower | Loan Amount |
|---|---|---|---|
| Open | Bisono Johnathan A | $93,279 | |
| Previous Owner | Spires David R | $43,500 |
Source: Public Records
Tax History Compared to Growth
Tax History
| Year | Tax Paid | Tax Assessment Tax Assessment Total Assessment is a certain percentage of the fair market value that is determined by local assessors to be the total taxable value of land and additions on the property. | Land | Improvement |
|---|---|---|---|---|
| 2025 | -- | $51,390 | $8,720 | $42,670 |
| 2024 | -- | $51,390 | $8,720 | $42,670 |
| 2023 | $1,265 | $31,470 | $6,900 | $24,570 |
| 2022 | $1,273 | $31,470 | $6,900 | $24,570 |
| 2021 | $1,081 | $26,010 | $6,900 | $19,110 |
| 2020 | $1,023 | $23,000 | $5,990 | $17,010 |
| 2019 | $1,009 | $23,000 | $5,990 | $17,010 |
| 2018 | $1,014 | $23,000 | $5,990 | $17,010 |
| 2017 | $868 | $19,330 | $4,660 | $14,670 |
| 2016 | $875 | $19,330 | $4,660 | $14,670 |
| 2015 | $375 | $19,190 | $4,660 | $14,530 |
| 2014 | $433 | $18,040 | $4,380 | $13,660 |
| 2013 | $40 | $18,040 | $4,380 | $13,660 |
Source: Public Records
Map
Nearby Homes
- 1515 S Rockhill Ave
- 884 W College Rd
- 1321 Parkway Blvd
- 738 Kingsway St
- 970 Kingsway St
- 1038 Fairview Place
- 1201 Overlook Dr
- 896 Parkway Blvd
- 2112 Blenheim Ave
- 112 E College St
- 2050 Federal Ave
- 1475 Chatauqua Ct
- 734 Parkway Blvd
- 725 W Summit St
- 1059 Oakwood Dr
- 645 W Summit St
- 2839 S Rockhill Ave
- 2220 Western Ave
- 807 S Union Ave
- 140 W Summit St
- 865 W College Rd
- 840 Lilly Rd
- 834 Lilly Rd
- 842 Lilly Rd
- 879 W College Rd
- 1645 S Rockhill Ave
- 1625 S Rockhill Ave
- 844 Lilly Rd
- 844 W College Rd
- 854 W College Rd
- 834 W College Rd
- 864 W College Rd
- 881 W College Rd
- 1705 S Rockhill Ave
- 884 Lilly Rd
- 1615 S Rockhill Ave
- 1715 S Rockhill Ave
- 895 W College Rd
- 1725 S Rockhill Ave
- 1608 Parkway Blvd