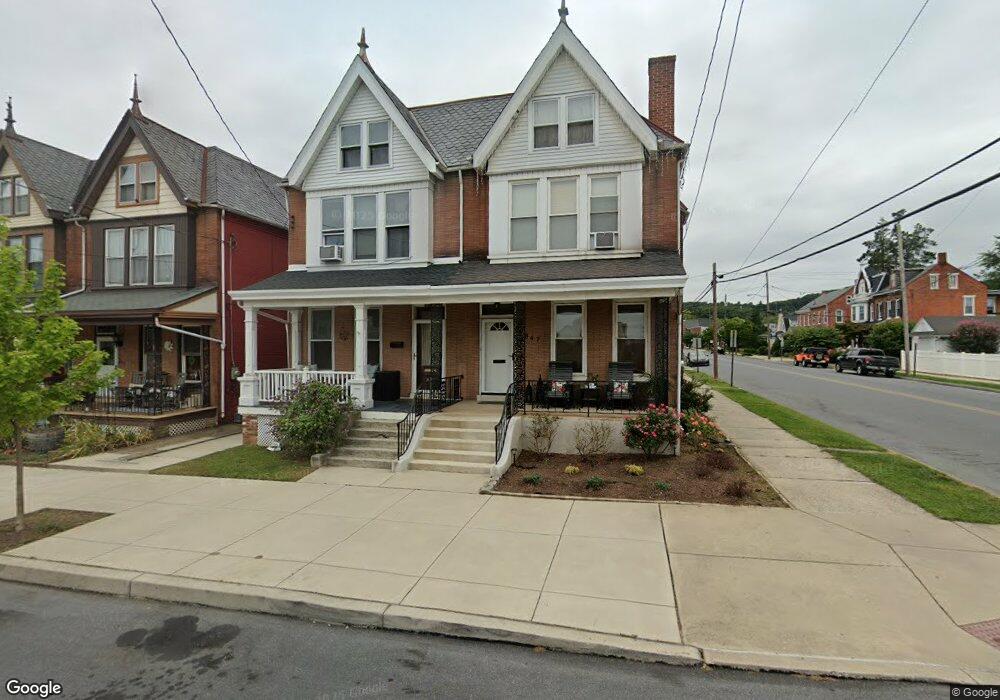
845 Walnut St Columbia, PA 17512
Estimated Value: $223,000 - $256,000
4
Beds
2
Baths
1,898
Sq Ft
$125/Sq Ft
Est. Value
About This Home
This home is located at 845 Walnut St, Columbia, PA 17512 and is currently estimated at $236,543, approximately $124 per square foot. 845 Walnut St is a home located in Lancaster County with nearby schools including Columbia Middle School, Columbia High School, and Our Lady of the Angels School.
Ownership History
Date
Name
Owned For
Owner Type
Purchase Details
Closed on
Nov 13, 2009
Sold by
Chow Yu Yin and Chen Yun Fang
Bought by
Horsey Kim R and Thompson Dana L
Current Estimated Value
Home Financials for this Owner
Home Financials are based on the most recent Mortgage that was taken out on this home.
Original Mortgage
$116,844
Outstanding Balance
$75,746
Interest Rate
4.86%
Mortgage Type
FHA
Estimated Equity
$160,797
Purchase Details
Closed on
Feb 25, 2009
Sold by
Fannie Mae
Bought by
Chow Yu Yin and Chen Yun Fang
Purchase Details
Closed on
Oct 2, 2008
Sold by
Harrington Jami A
Bought by
Federal National Mortgage Association
Purchase Details
Closed on
Jun 18, 2003
Sold by
Speece Michael R and Speece Teri L
Bought by
Harrington Jami A
Home Financials for this Owner
Home Financials are based on the most recent Mortgage that was taken out on this home.
Original Mortgage
$71,155
Interest Rate
5.71%
Mortgage Type
Purchase Money Mortgage
Create a Home Valuation Report for This Property
The Home Valuation Report is an in-depth analysis detailing your home's value as well as a comparison with similar homes in the area
Home Values in the Area
Average Home Value in this Area
Purchase History
| Date | Buyer | Sale Price | Title Company |
|---|---|---|---|
| Horsey Kim R | $119,000 | None Available | |
| Chow Yu Yin | $64,900 | None Available | |
| Federal National Mortgage Association | $2,939 | None Available | |
| Harrington Jami A | $74,900 | -- |
Source: Public Records
Mortgage History
| Date | Status | Borrower | Loan Amount |
|---|---|---|---|
| Open | Horsey Kim R | $116,844 | |
| Previous Owner | Harrington Jami A | $71,155 |
Source: Public Records
Tax History Compared to Growth
Tax History
| Year | Tax Paid | Tax Assessment Tax Assessment Total Assessment is a certain percentage of the fair market value that is determined by local assessors to be the total taxable value of land and additions on the property. | Land | Improvement |
|---|---|---|---|---|
| 2025 | $3,479 | $93,100 | $25,100 | $68,000 |
| 2024 | $3,479 | $93,100 | $25,100 | $68,000 |
| 2023 | $3,479 | $93,100 | $25,100 | $68,000 |
| 2022 | $3,479 | $93,100 | $25,100 | $68,000 |
| 2021 | $3,479 | $93,100 | $25,100 | $68,000 |
| 2020 | $3,479 | $93,100 | $25,100 | $68,000 |
| 2019 | $3,419 | $93,100 | $25,100 | $68,000 |
| 2018 | $2,094 | $93,100 | $25,100 | $68,000 |
| 2017 | $3,742 | $91,100 | $17,700 | $73,400 |
| 2016 | $3,742 | $91,100 | $17,700 | $73,400 |
| 2015 | $1,069 | $91,100 | $17,700 | $73,400 |
| 2014 | $2,268 | $91,100 | $17,700 | $73,400 |
Source: Public Records
Map
Nearby Homes