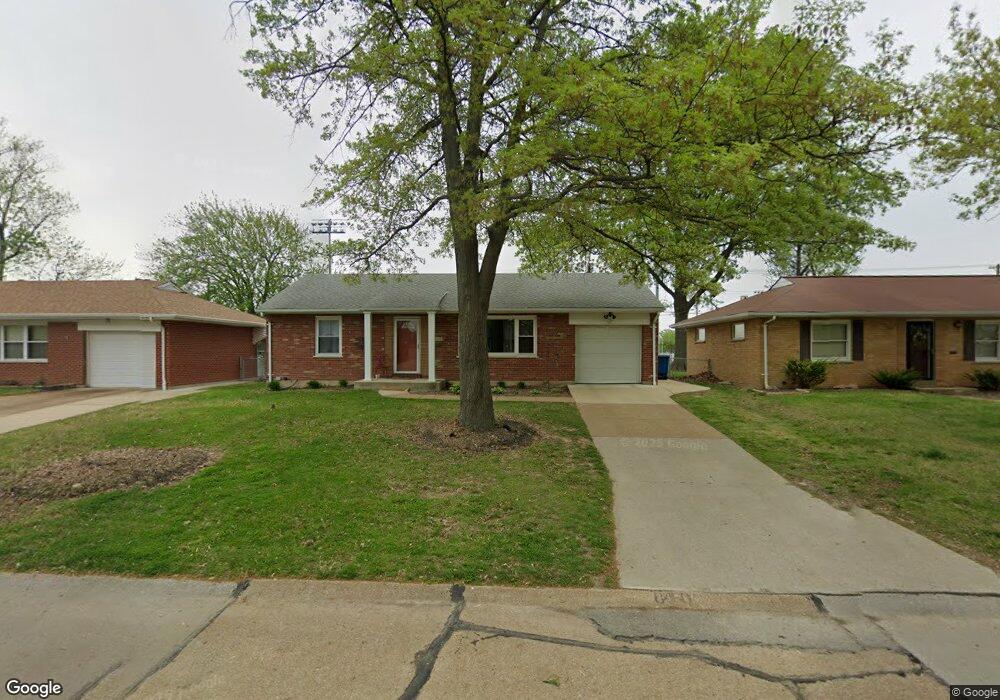
8450 Hampstead Dr Saint Louis, MO 63123
Estimated Value: $225,879 - $264,000
2
Beds
2
Baths
938
Sq Ft
$263/Sq Ft
Est. Value
About This Home
This home is located at 8450 Hampstead Dr, Saint Louis, MO 63123 and is currently estimated at $246,720, approximately $263 per square foot. 8450 Hampstead Dr is a home located in St. Louis County with nearby schools including Mesnier Primary School, Gotsch Intermediate School, and Rogers Middle School.
Ownership History
Date
Name
Owned For
Owner Type
Purchase Details
Closed on
Sep 21, 2021
Sold by
Lewis Diana L
Bought by
Lewis Diana L and Hempfling Stacey Lynne
Current Estimated Value
Home Financials for this Owner
Home Financials are based on the most recent Mortgage that was taken out on this home.
Original Mortgage
$106,000
Outstanding Balance
$96,242
Interest Rate
2.8%
Mortgage Type
New Conventional
Estimated Equity
$150,478
Purchase Details
Closed on
Apr 1, 2013
Sold by
Dolores L Henslee Revocable Living Trust
Bought by
Lewis Diana L
Home Financials for this Owner
Home Financials are based on the most recent Mortgage that was taken out on this home.
Original Mortgage
$92,102
Interest Rate
3.62%
Mortgage Type
New Conventional
Purchase Details
Closed on
Jul 28, 2011
Sold by
Henslee Dolores L and Henslee Dolores Lorraine
Bought by
Henslee Dolores L and Bunch Carla L
Purchase Details
Closed on
Aug 30, 2002
Sold by
Henslee Dolores Lorraine
Bought by
Bunch Carla Leann Henslee
Create a Home Valuation Report for This Property
The Home Valuation Report is an in-depth analysis detailing your home's value as well as a comparison with similar homes in the area
Home Values in the Area
Average Home Value in this Area
Purchase History
| Date | Buyer | Sale Price | Title Company |
|---|---|---|---|
| Lewis Diana L | -- | Continental Title | |
| Lewis Diana L | $96,950 | Insight Title | |
| Henslee Dolores L | -- | None Available | |
| Bunch Carla Leann Henslee | -- | -- |
Source: Public Records
Mortgage History
| Date | Status | Borrower | Loan Amount |
|---|---|---|---|
| Open | Lewis Diana L | $106,000 | |
| Closed | Lewis Diana L | $106,000 | |
| Previous Owner | Lewis Diana L | $92,102 |
Source: Public Records
Tax History Compared to Growth
Tax History
| Year | Tax Paid | Tax Assessment Tax Assessment Total Assessment is a certain percentage of the fair market value that is determined by local assessors to be the total taxable value of land and additions on the property. | Land | Improvement |
|---|---|---|---|---|
| 2025 | $2,880 | $43,340 | $14,930 | $28,410 |
| 2024 | $2,880 | $35,440 | $9,960 | $25,480 |
| 2023 | $2,880 | $35,440 | $9,960 | $25,480 |
| 2022 | $3,158 | $34,490 | $9,960 | $24,530 |
| 2021 | $2,883 | $34,490 | $9,960 | $24,530 |
| 2020 | $2,443 | $27,230 | $9,730 | $17,500 |
| 2019 | $2,438 | $27,230 | $9,730 | $17,500 |
| 2018 | $2,377 | $23,460 | $6,780 | $16,680 |
| 2017 | $2,362 | $23,460 | $6,780 | $16,680 |
| 2016 | $1,960 | $20,650 | $5,830 | $14,820 |
| 2015 | $1,968 | $20,650 | $5,830 | $14,820 |
| 2014 | $1,861 | $19,420 | $6,670 | $12,750 |
Source: Public Records
Map
Nearby Homes
- 8400 New Hampshire Ave
- 6325 Sheppard Dr
- 6540 Lawnside Dr
- 8505 Ava Dr
- 8554 Palmetto Dr
- 8509 Mackenzie Rd
- 6236 Bixby Ave
- 8736 New Hampshire Ave
- 6211 Bixby Ave
- 8613 Carriage Way Dr
- 8740 Brenda Ave
- 6205 MacKenzie Valley Ct
- 6426 Judson Ave
- 8942 Eden Ave
- 9702 Sterling Place
- 9506 Sterling Place
- 8315 Maylor Dr
- 8415 Rockhaven Ln
- 7123 Craighill Dr
- 8027 McGee St
- 8446 Hampstead Dr
- 8458 Hampstead Dr
- 8442 Hampstead Dr
- 8438 Hampstead Dr
- 8451 Hampstead Dr
- 8462 Hampstead Dr
- 8447 Hampstead Dr
- 8455 Hampstead Dr
- 8443 Hampstead Dr
- 8459 Hampstead Dr
- 8434 Hampstead Dr
- 8439 Hampstead Dr
- 8477 Hampstead Dr
- 8466 Hampstead Dr
- 8430 Hampstead Dr
- 8435 Hampstead Dr
- 8436 New Hampshire Ave
- 8432 New Hampshire Ave
- 8440 New Hampshire Ave
- 8428 New Hampshire Ave