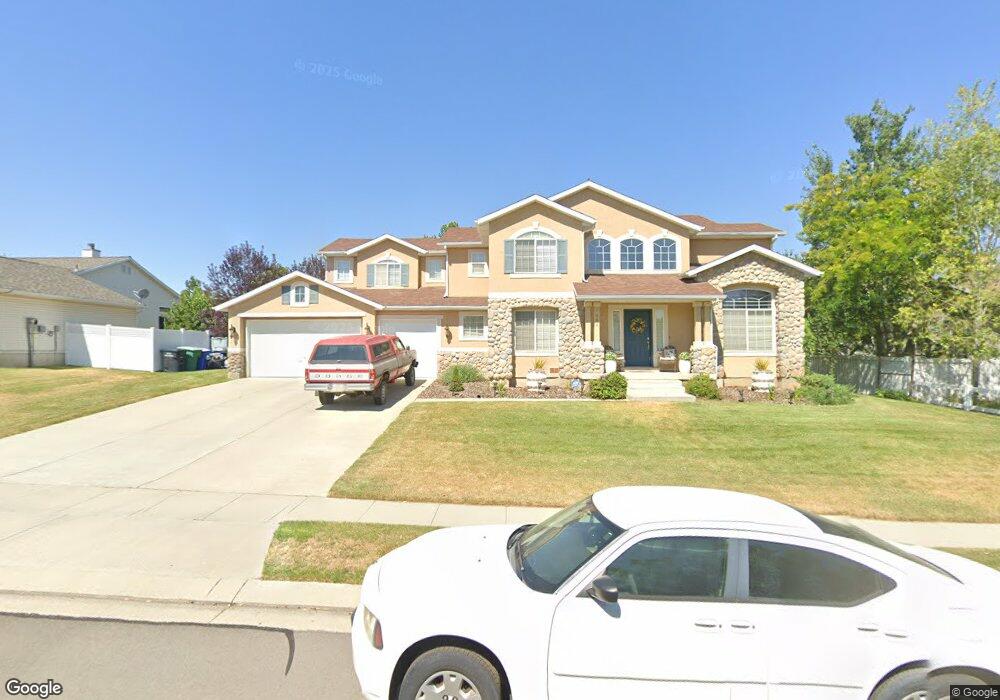
8454 Barnstable Dr West Jordan, UT 84081
Cobble Creek NeighborhoodEstimated Value: $650,000 - $698,000
4
Beds
3
Baths
2,581
Sq Ft
$261/Sq Ft
Est. Value
About This Home
This home is located at 8454 Barnstable Dr, West Jordan, UT 84081 and is currently estimated at $673,583, approximately $260 per square foot. 8454 Barnstable Dr is a home located in Salt Lake County with nearby schools including Hayden Peak Elementary School, West Hills Middle School, and Copper Hills High School.
Ownership History
Date
Name
Owned For
Owner Type
Purchase Details
Closed on
Aug 29, 2024
Sold by
Monte David and Monte Piper C
Bought by
David C Monte & Piper C Monte Living Trust and Monte
Current Estimated Value
Purchase Details
Closed on
Apr 23, 2018
Sold by
Monte David C and Monte Piper C
Bought by
Monte David and Monte Piper C
Home Financials for this Owner
Home Financials are based on the most recent Mortgage that was taken out on this home.
Original Mortgage
$342,400
Interest Rate
4.44%
Mortgage Type
New Conventional
Purchase Details
Closed on
Oct 21, 2002
Sold by
Monte David C
Bought by
Monte David C and Monte Piper C
Purchase Details
Closed on
Nov 5, 1998
Sold by
Scarlett Monte David C and Scarlett Monte E
Bought by
Monte David C
Purchase Details
Closed on
Nov 26, 1996
Sold by
Kaufman And Broad Utah Inc
Bought by
Scarlett Monte David C and Scarlett Monte E
Home Financials for this Owner
Home Financials are based on the most recent Mortgage that was taken out on this home.
Original Mortgage
$182,950
Interest Rate
7.91%
Create a Home Valuation Report for This Property
The Home Valuation Report is an in-depth analysis detailing your home's value as well as a comparison with similar homes in the area
Home Values in the Area
Average Home Value in this Area
Purchase History
| Date | Buyer | Sale Price | Title Company |
|---|---|---|---|
| David C Monte & Piper C Monte Living Trust | -- | None Listed On Document | |
| Monte David | -- | Multiple | |
| Monte David C | -- | First American Title | |
| Monte David C | $5,100 | -- | |
| Scarlett Monte David C | -- | First American Title |
Source: Public Records
Mortgage History
| Date | Status | Borrower | Loan Amount |
|---|---|---|---|
| Previous Owner | Monte David | $342,400 | |
| Previous Owner | Scarlett Monte David C | $182,950 |
Source: Public Records
Tax History Compared to Growth
Tax History
| Year | Tax Paid | Tax Assessment Tax Assessment Total Assessment is a certain percentage of the fair market value that is determined by local assessors to be the total taxable value of land and additions on the property. | Land | Improvement |
|---|---|---|---|---|
| 2025 | $3,388 | $654,800 | $171,200 | $483,600 |
| 2024 | $3,388 | $651,900 | $164,600 | $487,300 |
| 2023 | $3,266 | $592,200 | $158,300 | $433,900 |
| 2022 | $3,414 | $609,100 | $155,200 | $453,900 |
| 2021 | $3,025 | $491,300 | $119,400 | $371,900 |
| 2020 | $2,884 | $439,500 | $109,800 | $329,700 |
| 2019 | $2,828 | $422,600 | $103,600 | $319,000 |
| 2018 | $2,630 | $389,800 | $103,600 | $286,200 |
| 2017 | $2,521 | $372,100 | $103,600 | $268,500 |
| 2016 | $2,273 | $315,100 | $108,800 | $206,300 |
| 2015 | $2,275 | $307,600 | $116,500 | $191,100 |
| 2014 | $2,209 | $294,000 | $112,800 | $181,200 |
Source: Public Records
Map
Nearby Homes
- 8453 S Windmill Dr
- 5702 W Sophia Brook Ln
- 5746 W Swift Creek Rd
- 5719 W Boulder Creek Rd
- 8767 S Brown Park Dr
- 5582 Washoe Cove
- 5422 W Island Creek Dr
- 5946 W Eric Mountain Ln Unit 103
- 5946 W Eric Mountain Ln
- 5958 W Eric Mountain Ln
- 5958 W Eric Mountain Ln Unit 104
- 8854 Rocky Creek Dr
- 8501 S Michele River Ave
- 8501 S Michele River Ave Unit 116
- 8524 S Michele River Ave
- Larsen Plan at Copperhaven by Toll Brothers
- Brooke Plan at Copperhaven by Toll Brothers
- 8577 Autumn Gold Cir
- 8322 Copper Vista Cir
- 5298 W Icehouse Way
- 8438 Barnstable Dr
- 8438 S Barnstable Dr
- 8468 Barnstable Dr
- 8453 S Wild Oak Dr
- 8453 Wild Oak Dr
- 8467 S Wild Oak Dr
- 8437 Wild Oak Dr
- 8467 Wild Oak Dr
- 8455 Barnstable Dr
- 8441 Barnstable Dr
- 8424 Barnstable Dr
- 8484 Barnstable Dr
- 8484 S Barnstable Dr
- 8469 Barnstable Dr
- 8483 Wild Oak Dr
- 8423 Wild Oak Dr
- 8483 S Wild Oak Dr
- 8423 S Wild Oak Dr
- 8427 Barnstable Dr
- 8483 S Barnstable Dr