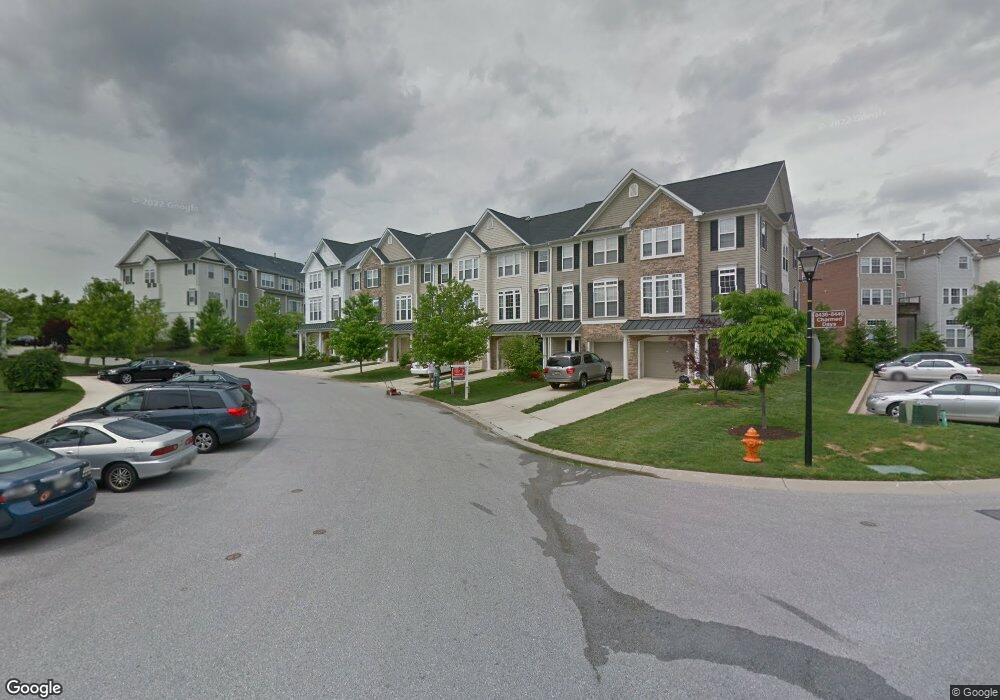
8456 Charmed Days Laurel, MD 20723
North Laurel NeighborhoodEstimated Value: $552,844 - $575,000
3
Beds
3
Baths
2,173
Sq Ft
$261/Sq Ft
Est. Value
About This Home
This home is located at 8456 Charmed Days, Laurel, MD 20723 and is currently estimated at $566,961, approximately $260 per square foot. 8456 Charmed Days is a home located in Howard County with nearby schools including Gorman Crossing Elementary School, Murray Hill Middle School, and Atholton High School.
Ownership History
Date
Name
Owned For
Owner Type
Purchase Details
Closed on
Jul 3, 2025
Sold by
Lechner Jennifer L
Bought by
Jennifer L Lechner Revocable Living Trust and Lechner
Current Estimated Value
Purchase Details
Closed on
Jan 16, 2015
Sold by
Kim Se Chung and Kim Ju Won
Bought by
Zhang Jinghao and Zhou Ke
Home Financials for this Owner
Home Financials are based on the most recent Mortgage that was taken out on this home.
Original Mortgage
$243,750
Interest Rate
3.81%
Mortgage Type
New Conventional
Purchase Details
Closed on
Jun 1, 2005
Sold by
Columbia Builders Inc
Bought by
Chung Kim Se and Won Kim Ju
Create a Home Valuation Report for This Property
The Home Valuation Report is an in-depth analysis detailing your home's value as well as a comparison with similar homes in the area
Home Values in the Area
Average Home Value in this Area
Purchase History
| Date | Buyer | Sale Price | Title Company |
|---|---|---|---|
| Jennifer L Lechner Revocable Living Trust | -- | None Listed On Document | |
| Jennifer L Lechner Revocable Living Trust | -- | None Listed On Document | |
| Zhang Jinghao | $325,000 | None Available | |
| Chung Kim Se | $434,746 | -- |
Source: Public Records
Mortgage History
| Date | Status | Borrower | Loan Amount |
|---|---|---|---|
| Previous Owner | Zhang Jinghao | $243,750 | |
| Closed | Chung Kim Se | -- |
Source: Public Records
Tax History Compared to Growth
Tax History
| Year | Tax Paid | Tax Assessment Tax Assessment Total Assessment is a certain percentage of the fair market value that is determined by local assessors to be the total taxable value of land and additions on the property. | Land | Improvement |
|---|---|---|---|---|
| 2025 | $6,515 | $444,000 | $130,000 | $314,000 |
| 2024 | $6,515 | $420,067 | $0 | $0 |
| 2023 | $6,121 | $396,133 | $0 | $0 |
| 2022 | $5,737 | $372,200 | $160,000 | $212,200 |
| 2021 | $5,737 | $372,200 | $160,000 | $212,200 |
| 2020 | $5,737 | $372,200 | $160,000 | $212,200 |
| 2019 | $6,107 | $398,000 | $150,000 | $248,000 |
| 2018 | $5,606 | $384,767 | $0 | $0 |
| 2017 | $5,404 | $398,000 | $0 | $0 |
| 2016 | -- | $358,300 | $0 | $0 |
| 2015 | -- | $343,600 | $0 | $0 |
| 2014 | -- | $328,900 | $0 | $0 |
Source: Public Records
Map
Nearby Homes
- 8440 Charmed Days
- 9956 Fragrant Lilies Way
- 9932 Fragrant Lilies Way
- 9850 Solar Course
- 9828 Snow Bird Ln
- 9768 Evening Bird Ln
- 10205 Deep Skies Dr
- 10213 Deep Skies Dr
- 10047 Fall Rain Dr
- 7870 Blackbriar Way
- 7866 Blackbriar Way
- 7862 Blackbriar Way
- 7858 Blackbriar Way
- 7840 Blackbriar Way
- 9843 Wilderness Ln
- 9046 Gorman Rd
- 7700 Cultivator Rd
- 7688 Blackbriar Way
- 7302 Isabella Rd
- 7323 Isabella Rd
- 8456 Charmed Days
- 8456 Charmed Days
- 8456 Charmed Days
- 8456 Charmed Days
- 8454 Charmed Days
- 8458 Charmed Days
- 8452 Charmed Days
- 8450 Charmed Days
- 8462 Charmed Days
- 9951 Fragrant Lilies Way
- 8429 Charmed Days
- 8429 Charmed Days
- 8429 Charmed Days
- 9953 Fragrant Lilies Way
- 8461 Charmed Days
- 8466 Charmed Days
- 8466 Charmed Days
- 9955 Fragrant Lilies Way
- 8466 Charmed Days
- 9947 Fragrant Lilies Way