Estimated Value: $526,256 - $568,000
--
Bed
3
Baths
3,243
Sq Ft
$168/Sq Ft
Est. Value
About This Home
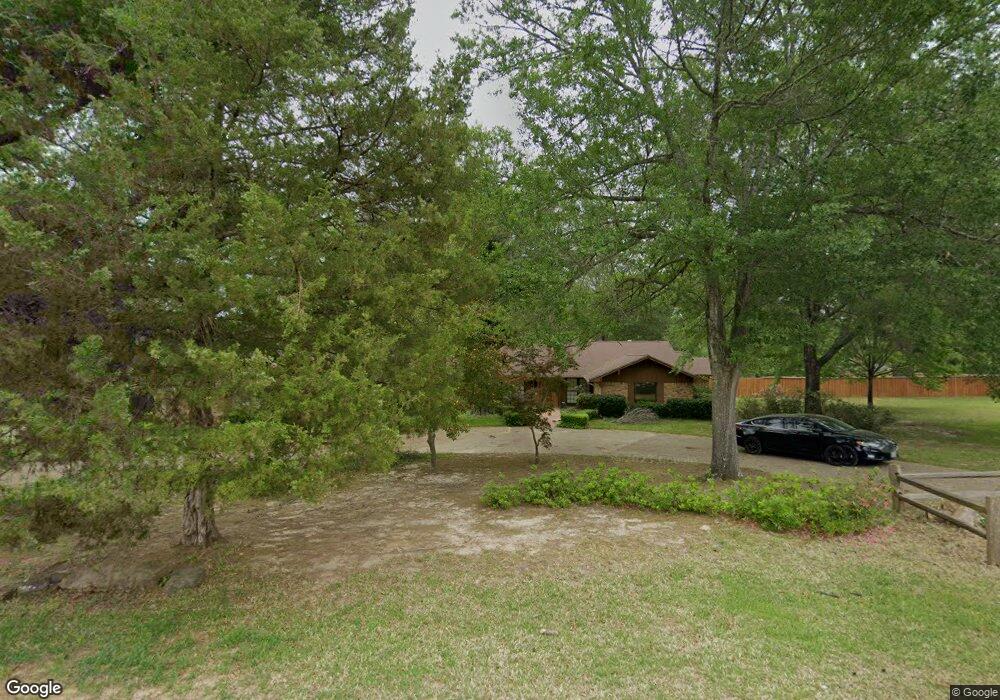
This home is located at 8458 8458 Southland, Tyler, TX 75703 and is currently estimated at $544,314, approximately $167 per square foot. 8458 8458 Southland is a home located in Smith County with nearby schools including Rice Elementary School, Hubbard Middle School, and Tyler Legacy High School.
Ownership History
Date
Name
Owned For
Owner Type
Purchase Details
Closed on
Sep 6, 2019
Sold by
Page Lyman E and Page Paulette G
Bought by
Davis David A and Davis Julie E
Current Estimated Value
Home Financials for this Owner
Home Financials are based on the most recent Mortgage that was taken out on this home.
Original Mortgage
$349,500
Outstanding Balance
$305,433
Interest Rate
3.7%
Mortgage Type
New Conventional
Estimated Equity
$238,881
Purchase Details
Closed on
Nov 8, 2013
Sold by
Mcneel Lillie C
Bought by
Page Lyman E and Page Paulette G
Home Financials for this Owner
Home Financials are based on the most recent Mortgage that was taken out on this home.
Original Mortgage
$160,000
Interest Rate
2.86%
Mortgage Type
Adjustable Rate Mortgage/ARM
Create a Home Valuation Report for This Property
The Home Valuation Report is an in-depth analysis detailing your home's value as well as a comparison with similar homes in the area
Home Values in the Area
Average Home Value in this Area
Purchase History
| Date | Buyer | Sale Price | Title Company |
|---|---|---|---|
| Davis David A | -- | None Available | |
| Page Lyman E | -- | None Available |
Source: Public Records
Mortgage History
| Date | Status | Borrower | Loan Amount |
|---|---|---|---|
| Open | Davis David A | $349,500 | |
| Previous Owner | Page Lyman E | $160,000 |
Source: Public Records
Tax History Compared to Growth
Tax History
| Year | Tax Paid | Tax Assessment Tax Assessment Total Assessment is a certain percentage of the fair market value that is determined by local assessors to be the total taxable value of land and additions on the property. | Land | Improvement |
|---|---|---|---|---|
| 2025 | $6,158 | $606,904 | $165,000 | $441,904 |
| 2024 | $6,158 | $422,910 | $71,800 | $454,808 |
| 2023 | $5,605 | $551,820 | $71,800 | $480,020 |
| 2022 | $6,847 | $349,513 | $35,900 | $313,613 |
| 2021 | $6,893 | $338,345 | $35,900 | $302,445 |
| 2020 | $6,391 | $298,667 | $35,900 | $262,767 |
| 2019 | $6,368 | $291,219 | $35,900 | $255,319 |
| 2018 | $6,156 | $283,049 | $35,900 | $247,149 |
| 2017 | $6,043 | $283,049 | $35,900 | $247,149 |
| 2016 | $6,051 | $283,452 | $35,900 | $247,552 |
| 2015 | $5,360 | $275,406 | $35,900 | $239,506 |
| 2014 | $5,360 | $268,272 | $35,900 | $232,372 |
Source: Public Records
Map
Nearby Homes
- 308 Canterbury Ct
- 628 Wilder Way
- 8310 Columbia Dr
- 419 Wilder Way
- 8312 Oxford Dr
- 700 Oxford Dr
- 708 Oxford Cir
- 719 Cambridge Bend Cir
- 6522 Emory Ct
- 8307 Garrett Dr
- 8412 Crooked Trail
- 8416 Crooked Trail
- 7889 Greenhill Dr
- 7415 Hollyoak Dr
- 411 W Heritage Dr
- 7614 Abbeywood Ct
- 231 W Cumberland Rd
- 202 Ronnette Dr
- The Beckham Plan at Cumberland Place West
- The Tanglewood Plan at Cumberland Place West
- 8458 Southland Dr
- 8505 Radcliffe Dr
- 8450 Southland Dr
- 8464 Southland Dr
- 8505 8505 Radcliffe
- 8425 Radcliffe Dr
- 8425 8425 Radcliffe Dr
- 8515 Radcliffe Dr
- 8449 Southland Dr
- 8449 8449 Southland
- 8415 Radcliffe Dr
- 8443 Southland Dr
- 8455 Southland Dr
- 8430 Radcliffe Dr
- 8525 Radcliffe Dr
- 8424 Radcliffe Dr
- 8714 Radcliffe Dr
- 8486 Southland Dr
- 8514 Radcliffe Dr
- 8405 Radcliffe Dr