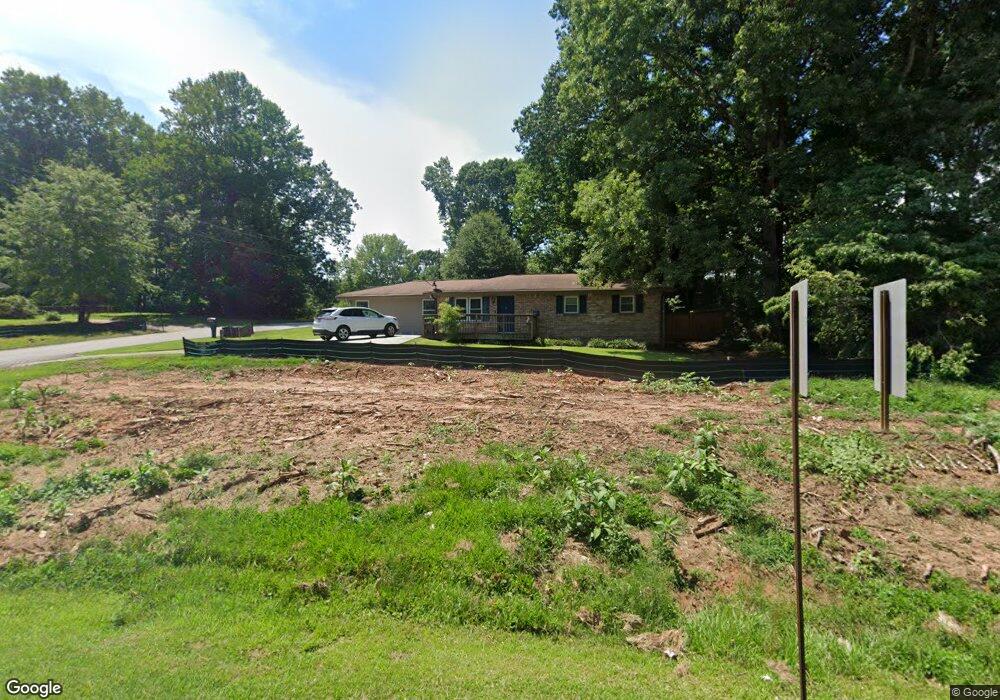
8459 Lee Rd Lithia Springs, GA 30122
Lithia Springs NeighborhoodEstimated Value: $215,000 - $233,020
3
Beds
2
Baths
1,475
Sq Ft
$153/Sq Ft
Est. Value
About This Home
This home is located at 8459 Lee Rd, Lithia Springs, GA 30122 and is currently estimated at $225,755, approximately $153 per square foot. 8459 Lee Rd is a home located in Douglas County with nearby schools including Sweetwater Elementary School, Factory Shoals Middle School, and Lithia Springs Comprehensive High School.
Ownership History
Date
Name
Owned For
Owner Type
Purchase Details
Closed on
Oct 28, 2020
Sold by
Smith Mary S
Bought by
Smith Julie Nicole
Current Estimated Value
Home Financials for this Owner
Home Financials are based on the most recent Mortgage that was taken out on this home.
Original Mortgage
$118,487
Outstanding Balance
$105,437
Interest Rate
2.8%
Mortgage Type
FHA
Estimated Equity
$120,318
Create a Home Valuation Report for This Property
The Home Valuation Report is an in-depth analysis detailing your home's value as well as a comparison with similar homes in the area
Home Values in the Area
Average Home Value in this Area
Purchase History
| Date | Buyer | Sale Price | Title Company |
|---|---|---|---|
| Smith Julie Nicole | $137,000 | -- |
Source: Public Records
Mortgage History
| Date | Status | Borrower | Loan Amount |
|---|---|---|---|
| Open | Smith Julie Nicole | $118,487 |
Source: Public Records
Tax History Compared to Growth
Tax History
| Year | Tax Paid | Tax Assessment Tax Assessment Total Assessment is a certain percentage of the fair market value that is determined by local assessors to be the total taxable value of land and additions on the property. | Land | Improvement |
|---|---|---|---|---|
| 2024 | $2,347 | $74,600 | $19,200 | $55,400 |
| 2023 | $2,347 | $74,600 | $19,200 | $55,400 |
| 2022 | $1,571 | $48,240 | $12,000 | $36,240 |
| 2021 | $1,353 | $41,480 | $12,720 | $28,760 |
| 2020 | $302 | $41,480 | $12,720 | $28,760 |
| 2019 | $245 | $40,760 | $12,720 | $28,040 |
| 2018 | $245 | $34,360 | $11,040 | $23,320 |
| 2017 | $259 | $31,600 | $11,040 | $20,560 |
| 2016 | $190 | $22,840 | $9,120 | $13,720 |
| 2015 | $255 | $22,440 | $9,120 | $13,320 |
| 2014 | $255 | $26,800 | $11,400 | $15,400 |
| 2013 | -- | $28,120 | $12,000 | $16,120 |
Source: Public Records
Map
Nearby Homes
- 3570 Briar Dr
- 2499 Chestnut Log Loop
- 3646 Briar Dr
- 3652 Sweetbriar Cir
- 3686 Sweetbriar Cir
- 1940 Lee
- LOT 27 Chestnut Ln
- 3790 Sweetbriar Cir
- 8684 Hickory Ln
- HAYDEN Plan at Fairhaven
- GREEN Plan at Fairhaven
- CALI Plan at Fairhaven
- ELLE Plan at Fairhaven
- PENWELL Plan at Fairhaven
- 2322 Chestnut Log Loop
- 1774 Trail Creek Dr
- 2275 Chestnut Log Loop
- 3948 Fairhaven Rd
- 1815 Lee Rd
- 2756 Montie Ct