Estimated Value: $157,000 - $198,000
4
Beds
2
Baths
1,156
Sq Ft
$148/Sq Ft
Est. Value
About This Home
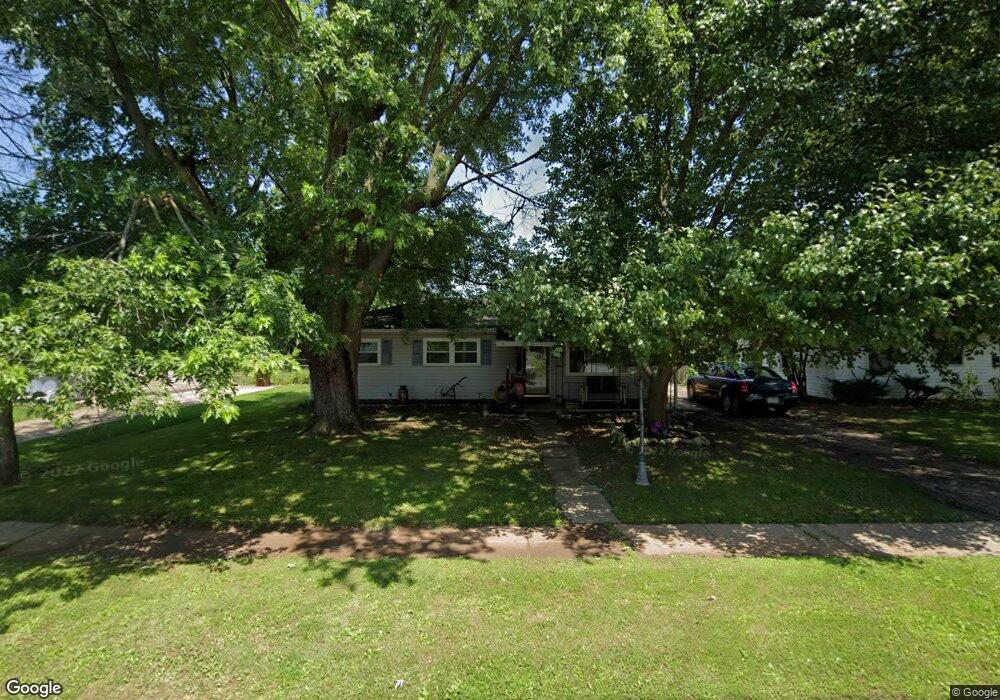
This home is located at 846 Boylan Dr, Xenia, OH 45385 and is currently estimated at $171,394, approximately $148 per square foot. 846 Boylan Dr is a home located in Greene County with nearby schools including Xenia High School, Summit Academy Community School for Alternative Learners - Xenia, and Legacy Christian Academy.
Ownership History
Date
Name
Owned For
Owner Type
Purchase Details
Closed on
Jun 5, 2012
Sold by
Williamson Kimberlie A
Bought by
Kaws Holdings Llc
Current Estimated Value
Purchase Details
Closed on
Aug 18, 2009
Sold by
Secretary Of Veterans Affairs
Bought by
Wsons Llc
Purchase Details
Closed on
Jul 28, 2009
Sold by
Rowland Michael D and Rowland Patricia L
Bought by
Secretary Of Veterans Affairs
Purchase Details
Closed on
Jul 21, 2000
Sold by
Shirley Callahan and Shirley N
Bought by
Rowland Michael D and Rowland Patricia L
Home Financials for this Owner
Home Financials are based on the most recent Mortgage that was taken out on this home.
Original Mortgage
$70,380
Interest Rate
8.19%
Mortgage Type
VA
Create a Home Valuation Report for This Property
The Home Valuation Report is an in-depth analysis detailing your home's value as well as a comparison with similar homes in the area
Home Values in the Area
Average Home Value in this Area
Purchase History
| Date | Buyer | Sale Price | Title Company |
|---|---|---|---|
| Kaws Holdings Llc | -- | None Available | |
| Wsons Llc | -- | Accutitle Agency Inc | |
| Secretary Of Veterans Affairs | $50,000 | None Available | |
| Rowland Michael D | $69,000 | -- |
Source: Public Records
Mortgage History
| Date | Status | Borrower | Loan Amount |
|---|---|---|---|
| Previous Owner | Rowland Michael D | $70,380 |
Source: Public Records
Tax History Compared to Growth
Tax History
| Year | Tax Paid | Tax Assessment Tax Assessment Total Assessment is a certain percentage of the fair market value that is determined by local assessors to be the total taxable value of land and additions on the property. | Land | Improvement |
|---|---|---|---|---|
| 2024 | $1,642 | $38,370 | $7,940 | $30,430 |
| 2023 | $1,642 | $38,370 | $7,940 | $30,430 |
| 2022 | $1,354 | $26,990 | $5,670 | $21,320 |
| 2021 | $1,372 | $26,990 | $5,670 | $21,320 |
| 2020 | $1,315 | $26,990 | $5,670 | $21,320 |
| 2019 | $1,091 | $21,080 | $4,250 | $16,830 |
| 2018 | $1,095 | $21,080 | $4,250 | $16,830 |
| 2017 | $1,043 | $21,080 | $4,250 | $16,830 |
| 2016 | $1,043 | $19,710 | $4,250 | $15,460 |
| 2015 | $1,046 | $19,710 | $4,250 | $15,460 |
| 2014 | $1,002 | $19,710 | $4,250 | $15,460 |
Source: Public Records
Map
Nearby Homes