Estimated Value: $97,000 - $149,000
2
Beds
1
Bath
1,176
Sq Ft
$108/Sq Ft
Est. Value
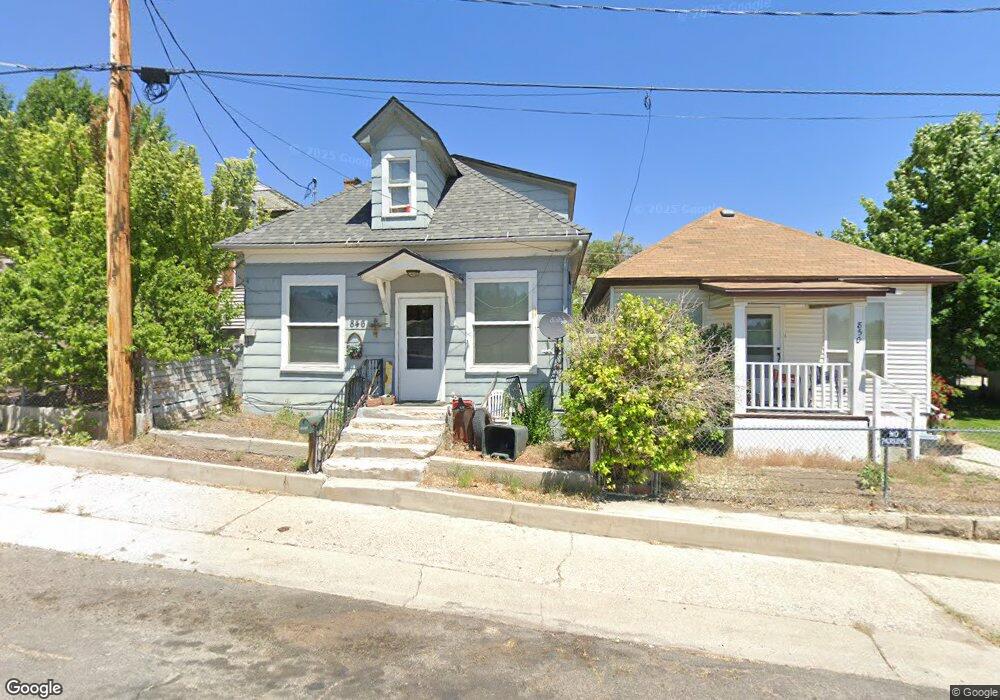
About This Home
This home is located at 846 High St, Ely, NV 89301 and is currently estimated at $127,308, approximately $108 per square foot. 846 High St is a home located in White Pine County with nearby schools including David E. Norman Elementary School, White Pine Middle School, and White Pine High School.
Ownership History
Date
Name
Owned For
Owner Type
Purchase Details
Closed on
Feb 22, 2019
Sold by
Mcessy Kristi
Bought by
Harshman Renee
Current Estimated Value
Purchase Details
Closed on
Oct 27, 2005
Sold by
Harshman Renee S
Bought by
Mcessy Kristi and Jakobiak Craig
Home Financials for this Owner
Home Financials are based on the most recent Mortgage that was taken out on this home.
Original Mortgage
$54,400
Interest Rate
5.72%
Purchase Details
Closed on
Sep 16, 2005
Sold by
Mcessy Kristi
Bought by
Harshman Renee S
Home Financials for this Owner
Home Financials are based on the most recent Mortgage that was taken out on this home.
Original Mortgage
$54,400
Interest Rate
5.72%
Purchase Details
Closed on
Feb 18, 2005
Sold by
Pratt Patricia A
Bought by
Harshman Renee S and Mcessy Kristi
Create a Home Valuation Report for This Property
The Home Valuation Report is an in-depth analysis detailing your home's value as well as a comparison with similar homes in the area
Home Values in the Area
Average Home Value in this Area
Purchase History
| Date | Buyer | Sale Price | Title Company |
|---|---|---|---|
| Harshman Renee | $29,283 | None Available | |
| Mcessy Kristi | $27,000 | -- | |
| Harshman Renee S | -- | Stewart Title Of Northeaster | |
| Harshman Renee S | $25,000 | Stewart Title Of Northeaster |
Source: Public Records
Mortgage History
| Date | Status | Borrower | Loan Amount |
|---|---|---|---|
| Previous Owner | Harshman Renee S | $54,400 |
Source: Public Records
Tax History
| Year | Tax Paid | Tax Assessment Tax Assessment Total Assessment is a certain percentage of the fair market value that is determined by local assessors to be the total taxable value of land and additions on the property. | Land | Improvement |
|---|---|---|---|---|
| 2025 | $494 | $14,994 | $1,514 | $13,480 |
| 2024 | $494 | $14,733 | $1,356 | $13,377 |
| 2023 | $494 | $13,428 | $1,356 | $12,072 |
| 2022 | $463 | $11,657 | $1,181 | $10,476 |
| 2021 | $438 | $10,988 | $1,181 | $9,807 |
| 2020 | $448 | $11,261 | $1,181 | $10,080 |
| 2019 | $426 | $10,643 | $1,181 | $9,462 |
| 2018 | $411 | $10,249 | $1,181 | $9,068 |
| 2017 | $391 | $10,057 | $1,077 | $8,980 |
| 2016 | $380 | $9,316 | $1,077 | $8,239 |
| 2015 | $319 | $9,234 | $1,077 | $8,157 |
| 2014 | $319 | $9,275 | $1,278 | $7,997 |
Source: Public Records
Map
Nearby Homes
Your Personal Tour Guide
Ask me questions while you tour the home.