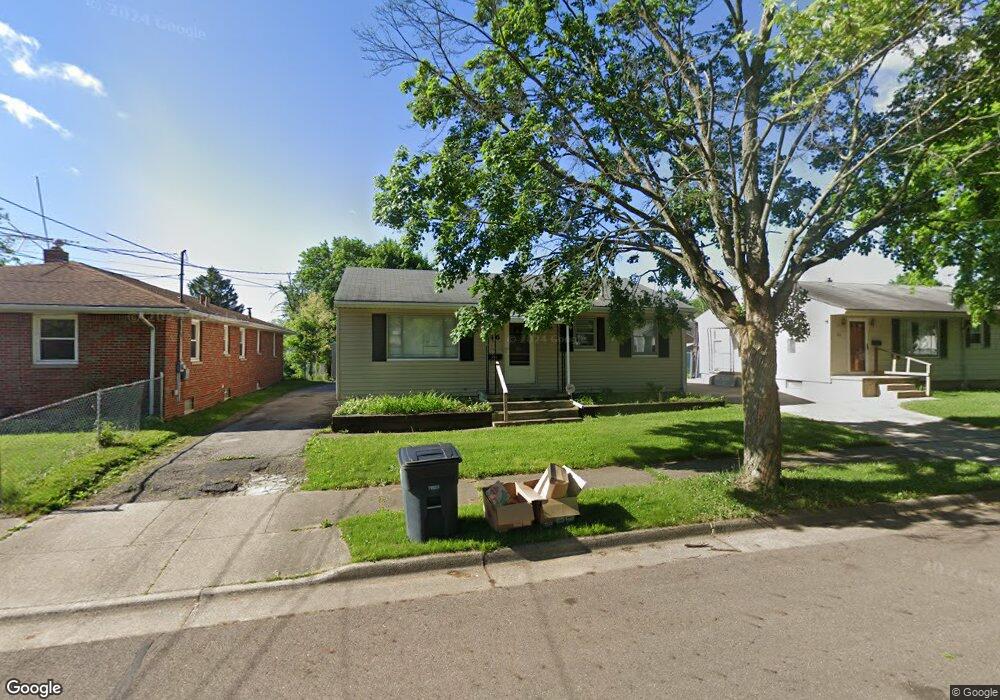
846 Hunt St Akron, OH 44306
East Akron NeighborhoodEstimated Value: $84,145 - $102,000
3
Beds
1
Bath
1,008
Sq Ft
$96/Sq Ft
Est. Value
About This Home
This home is located at 846 Hunt St, Akron, OH 44306 and is currently estimated at $96,286, approximately $95 per square foot. 846 Hunt St is a home located in Summit County with nearby schools including Glover Community Learning Center, Kenmore Garfield Community Learning Center, and Eagle Elementary.
Ownership History
Date
Name
Owned For
Owner Type
Purchase Details
Closed on
Sep 9, 2010
Sold by
Bailey Helen A
Bought by
Traore Masse
Current Estimated Value
Home Financials for this Owner
Home Financials are based on the most recent Mortgage that was taken out on this home.
Original Mortgage
$43,000
Outstanding Balance
$28,538
Interest Rate
4.54%
Mortgage Type
New Conventional
Estimated Equity
$67,748
Create a Home Valuation Report for This Property
The Home Valuation Report is an in-depth analysis detailing your home's value as well as a comparison with similar homes in the area
Home Values in the Area
Average Home Value in this Area
Purchase History
| Date | Buyer | Sale Price | Title Company |
|---|---|---|---|
| Traore Masse | $43,000 | Village Title |
Source: Public Records
Mortgage History
| Date | Status | Borrower | Loan Amount |
|---|---|---|---|
| Open | Traore Masse | $43,000 |
Source: Public Records
Tax History
| Year | Tax Paid | Tax Assessment Tax Assessment Total Assessment is a certain percentage of the fair market value that is determined by local assessors to be the total taxable value of land and additions on the property. | Land | Improvement |
|---|---|---|---|---|
| 2024 | $1,039 | $18,473 | $4,592 | $13,881 |
| 2023 | $1,039 | $18,473 | $4,592 | $13,881 |
| 2022 | $942 | $13,028 | $3,147 | $9,881 |
| 2021 | $943 | $13,028 | $3,147 | $9,881 |
| 2020 | $1,093 | $13,030 | $3,150 | $9,880 |
| 2019 | $1,169 | $15,230 | $4,140 | $11,090 |
| 2018 | $1,154 | $15,230 | $4,140 | $11,090 |
| 2017 | $1,191 | $15,230 | $4,140 | $11,090 |
| 2016 | $1,192 | $15,500 | $4,140 | $11,360 |
| 2015 | $1,191 | $15,500 | $4,140 | $11,360 |
| 2014 | $1,182 | $15,500 | $4,140 | $11,360 |
| 2013 | $1,159 | $15,500 | $4,140 | $11,360 |
Source: Public Records
Map
Nearby Homes
- 941 Hunt St
- 718 Virginia Ave
- 970 Hunt St
- 0 Clara Ave
- 884 Lovers Ln
- 918 Lovers Ln
- 920 Rowe St
- 791 Georgia Ave
- 1093 Joy Ave
- 1095 E Archwood Ave
- 675 Hudson Ave
- 920 Clement St
- 749 Mckinley Ave
- 833 Triplett Blvd
- 801 Triplett Blvd
- 697 Roscoe Ave
- 547 van Everett Ave
- 1243 Herberich Ave
- 1281 Neptune Ave
- 807 Baird St
Your Personal Tour Guide
Ask me questions while you tour the home.