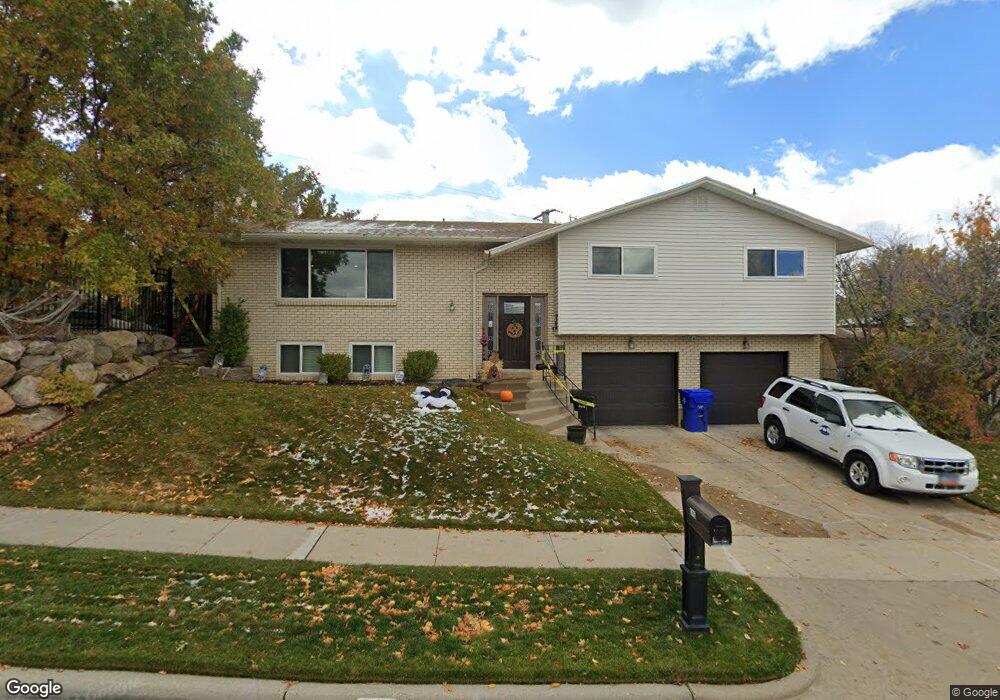
846 San Simeon Way Bountiful, UT 84010
Estimated Value: $593,000 - $618,000
4
Beds
3
Baths
1,482
Sq Ft
$410/Sq Ft
Est. Value
About This Home
This home is located at 846 San Simeon Way, Bountiful, UT 84010 and is currently estimated at $607,596, approximately $409 per square foot. 846 San Simeon Way is a home located in Davis County with nearby schools including Muir School, Mueller Park Junior High School, and Bountiful High School.
Ownership History
Date
Name
Owned For
Owner Type
Purchase Details
Closed on
Aug 16, 2017
Sold by
Pearson Brandon G and Pearson Christine
Bought by
Pond Monica B and Pond Beauen A
Current Estimated Value
Home Financials for this Owner
Home Financials are based on the most recent Mortgage that was taken out on this home.
Original Mortgage
$252,000
Outstanding Balance
$209,771
Interest Rate
3.96%
Mortgage Type
New Conventional
Estimated Equity
$397,825
Purchase Details
Closed on
Jul 15, 2011
Sold by
Pearson Melvin J and Pearson Kathy
Bought by
Pearson Brandon G and Pearson Christine
Home Financials for this Owner
Home Financials are based on the most recent Mortgage that was taken out on this home.
Original Mortgage
$180,000
Interest Rate
4.5%
Mortgage Type
New Conventional
Purchase Details
Closed on
Sep 9, 2010
Sold by
Pearson Melvin J
Bought by
Pearson Melvin J and Pearson Kathy
Create a Home Valuation Report for This Property
The Home Valuation Report is an in-depth analysis detailing your home's value as well as a comparison with similar homes in the area
Purchase History
We collect this data history from publicly available records. To have your information removed, we recommend requesting removal directly through your county’s website.
| Date | Buyer | Sale Price | Title Company |
|---|---|---|---|
| Pond Monica B | -- | Meridian Title | |
| Pearson Brandon G | -- | Bonneville Superior | |
| Pearson Melvin J | -- | American Dream Title Ins |
Source: Public Records
Mortgage History
We collect this data history from publicly available records. To have your information removed, we recommend requesting removal directly through your county’s website.
| Date | Status | Borrower | Loan Amount |
|---|---|---|---|
| Open | Pond Monica B | $252,000 | |
| Previous Owner | Pearson Brandon G | $180,000 |
Source: Public Records
Tax History
| Year | Tax Paid | Tax Assessment Tax Assessment Total Assessment is a certain percentage of the fair market value that is determined by local assessors to be the total taxable value of land and additions on the property. | Land | Improvement |
|---|---|---|---|---|
| 2025 | $3,175 | $287,650 | $134,796 | $152,854 |
| 2024 | $2,964 | $278,300 | $124,267 | $154,033 |
| 2023 | $2,858 | $267,850 | $124,026 | $143,823 |
| 2022 | $2,973 | $506,000 | $218,371 | $287,629 |
| 2021 | $2,629 | $376,000 | $178,525 | $197,475 |
| 2020 | $2,324 | $333,000 | $162,553 | $170,447 |
| 2019 | $2,349 | $329,000 | $159,714 | $169,286 |
| 2018 | $2,160 | $297,000 | $148,421 | $148,579 |
| 2016 | $1,906 | $142,175 | $48,286 | $93,889 |
| 2015 | $1,862 | $131,065 | $48,286 | $82,779 |
| 2014 | $1,795 | $129,866 | $48,286 | $81,580 |
| 2013 | -- | $123,467 | $50,161 | $73,306 |
Source: Public Records
Map
Nearby Homes
- 831 E San Simeon Way S
- 761 San Simeon Way
- 2136 S 900 E
- 721 E 1950 S
- 994 Deborah Dr
- 610 Meadowlark Ln
- 1885 Spring Creek Dr
- 1812 S 900 E
- 2675 S 450 E
- 0 Bountiful Blvd
- 1853 Jeri Dr
- 1761 S Davis Blvd
- 320 E 2100 S
- 2059 S 350 E Unit 6
- 295 E 2050 S Unit 1
- 2046 S 350 E Unit 4
- 2038 S 350 E Unit 3
- 631 E 1700 S
- 221 E 2450 S
- 296 E 2050 S Unit 2
- 831 E San Simeon Way S Unit 41
- 841 San Simeon Way
- 801 San Simeon Way
- 842 E 2150 S Unit 12
- 826 E 2150 S
- 851 San Simeon Way
- 791 San Simeon Way
- 830 San Simeon Way
- 812 E 2150 S
- 854 E 2150 S
- 798 San Simeon Way
- 861 San Simeon Way
- 781 San Simeon Way
- 798 E 2150 S
- 2250 S 850 E
- 870 E 2150 S
- 2146 S 850 E
- 786 San Simeon Way
- 2196 S 900 E
- 771 San Simeon Way
Your Personal Tour Guide
Ask me questions while you tour the home.