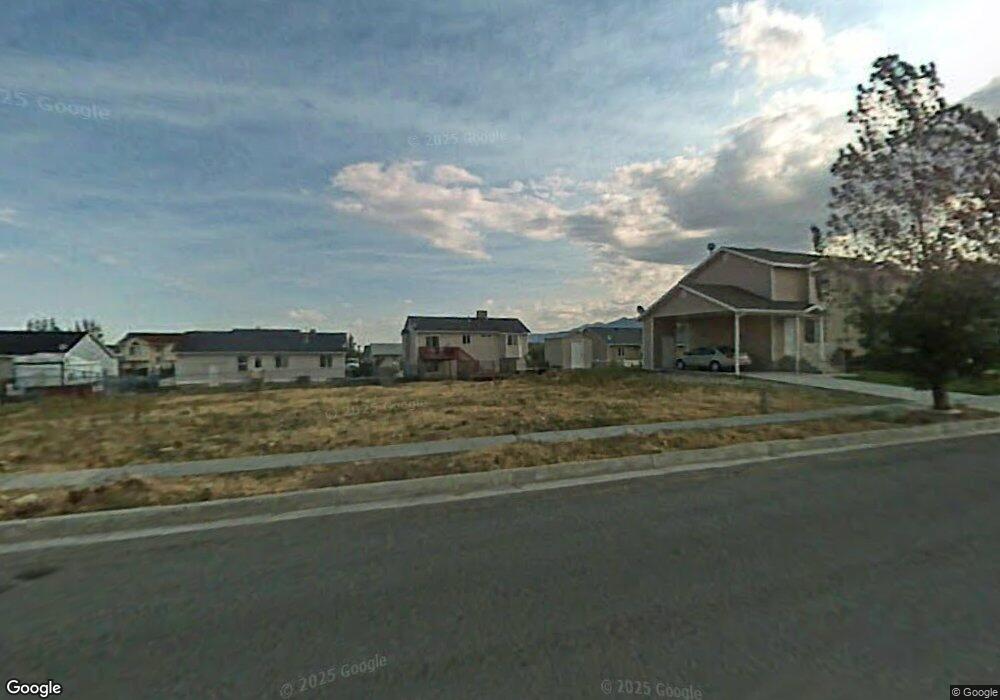
846 W 700 S Unit 17A Tooele, UT 84074
Estimated Value: $361,000 - $498,000
--
Bed
--
Bath
1,878
Sq Ft
$214/Sq Ft
Est. Value
About This Home
This home is located at 846 W 700 S Unit 17A, Tooele, UT 84074 and is currently estimated at $402,738, approximately $214 per square foot. 846 W 700 S Unit 17A is a home located in Tooele County with nearby schools including West Elementary School, Northlake Elementary School, and Tooele Junior High School.
Ownership History
Date
Name
Owned For
Owner Type
Purchase Details
Closed on
Nov 8, 2012
Sold by
Shupe Builders Llc
Bought by
Shupe Jared
Current Estimated Value
Purchase Details
Closed on
Jul 26, 2012
Sold by
Vigil Jason and Vigil Autumn
Bought by
Shupe Builders Llc
Purchase Details
Closed on
Jan 18, 2008
Sold by
Manchester Homes Llc
Bought by
Vigil Jason and Vigil Autumn
Home Financials for this Owner
Home Financials are based on the most recent Mortgage that was taken out on this home.
Original Mortgage
$39,920
Interest Rate
5.96%
Mortgage Type
Purchase Money Mortgage
Purchase Details
Closed on
Nov 30, 2007
Sold by
Robertson Bradley S and Robertson Patricia S
Bought by
Manchseter Homes Llc
Home Financials for this Owner
Home Financials are based on the most recent Mortgage that was taken out on this home.
Original Mortgage
$39,920
Interest Rate
5.96%
Mortgage Type
Purchase Money Mortgage
Create a Home Valuation Report for This Property
The Home Valuation Report is an in-depth analysis detailing your home's value as well as a comparison with similar homes in the area
Home Values in the Area
Average Home Value in this Area
Purchase History
| Date | Buyer | Sale Price | Title Company |
|---|---|---|---|
| Shupe Jared | -- | Metro National Title | |
| Shupe Builders Llc | -- | Inwest Title Services Inc | |
| Vigil Jason | -- | Security Title Ins Agen | |
| Manchseter Homes Llc | -- | Security Title |
Source: Public Records
Mortgage History
| Date | Status | Borrower | Loan Amount |
|---|---|---|---|
| Previous Owner | Vigil Jason | $39,920 |
Source: Public Records
Tax History Compared to Growth
Tax History
| Year | Tax Paid | Tax Assessment Tax Assessment Total Assessment is a certain percentage of the fair market value that is determined by local assessors to be the total taxable value of land and additions on the property. | Land | Improvement |
|---|---|---|---|---|
| 2025 | $2,306 | $192,359 | $50,188 | $142,171 |
| 2024 | $2,575 | $196,516 | $50,188 | $146,328 |
| 2023 | $2,575 | $211,092 | $47,810 | $163,282 |
| 2022 | $2,483 | $213,621 | $62,453 | $151,168 |
| 2021 | $1,322 | $95,166 | $18,597 | $76,569 |
| 2020 | $1,258 | $157,013 | $33,813 | $123,200 |
| 2019 | $1,279 | $157,013 | $33,813 | $123,200 |
| 2018 | $1,280 | $149,074 | $35,000 | $114,074 |
| 2017 | $1,178 | $162,754 | $35,000 | $127,754 |
| 2016 | $1,091 | $79,360 | $9,281 | $70,079 |
| 2015 | $1,091 | $79,360 | $0 | $0 |
| 2014 | -- | $79,360 | $0 | $0 |
Source: Public Records
Map
Nearby Homes