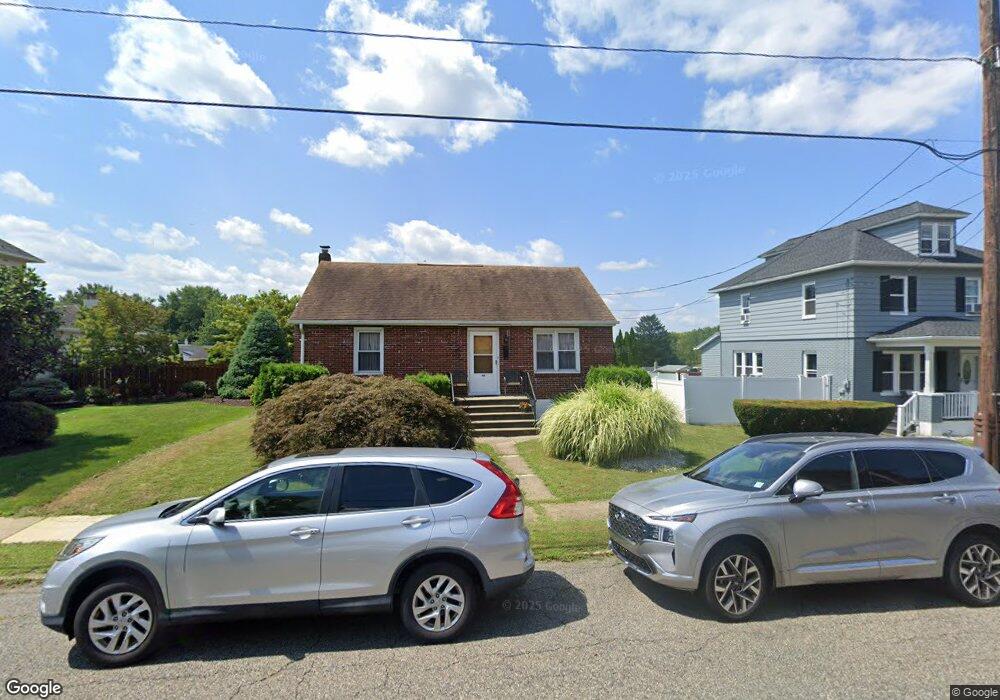
846 Wilbur Ave Phillipsburg, NJ 08865
Estimated Value: $263,000 - $298,000
--
Bed
--
Bath
884
Sq Ft
$319/Sq Ft
Est. Value
About This Home
This home is located at 846 Wilbur Ave, Phillipsburg, NJ 08865 and is currently estimated at $282,285, approximately $319 per square foot. 846 Wilbur Ave is a home located in Warren County with nearby schools including Phillipsburg High School, Easton Arts Academy Elementary Cs, and Sts. Philip & James School.
Ownership History
Date
Name
Owned For
Owner Type
Purchase Details
Closed on
Aug 31, 2006
Sold by
Dila Bessie and Dilo Vasilia
Bought by
Rossi Cheryl
Current Estimated Value
Home Financials for this Owner
Home Financials are based on the most recent Mortgage that was taken out on this home.
Original Mortgage
$149,000
Outstanding Balance
$121,140
Interest Rate
6.83%
Mortgage Type
Purchase Money Mortgage
Estimated Equity
$161,145
Create a Home Valuation Report for This Property
The Home Valuation Report is an in-depth analysis detailing your home's value as well as a comparison with similar homes in the area
Home Values in the Area
Average Home Value in this Area
Purchase History
| Date | Buyer | Sale Price | Title Company |
|---|---|---|---|
| Rossi Cheryl | $189,000 | Fidelity Natl Title Ins Co |
Source: Public Records
Mortgage History
| Date | Status | Borrower | Loan Amount |
|---|---|---|---|
| Open | Rossi Cheryl | $149,000 |
Source: Public Records
Tax History Compared to Growth
Tax History
| Year | Tax Paid | Tax Assessment Tax Assessment Total Assessment is a certain percentage of the fair market value that is determined by local assessors to be the total taxable value of land and additions on the property. | Land | Improvement |
|---|---|---|---|---|
| 2025 | $5,690 | $125,200 | $35,300 | $89,900 |
| 2024 | $5,253 | $125,200 | $35,300 | $89,900 |
| 2023 | $5,193 | $125,200 | $35,300 | $89,900 |
| 2022 | $5,193 | $125,200 | $35,300 | $89,900 |
| 2021 | $5,027 | $125,200 | $35,300 | $89,900 |
| 2020 | $5,061 | $125,200 | $35,300 | $89,900 |
| 2019 | $4,984 | $125,200 | $35,300 | $89,900 |
| 2018 | $4,984 | $125,200 | $35,300 | $89,900 |
| 2017 | $4,962 | $125,200 | $35,300 | $89,900 |
| 2016 | $4,885 | $125,200 | $35,300 | $89,900 |
| 2015 | $4,848 | $125,200 | $35,300 | $89,900 |
| 2014 | $4,690 | $125,200 | $35,300 | $89,900 |
Source: Public Records
Map
Nearby Homes