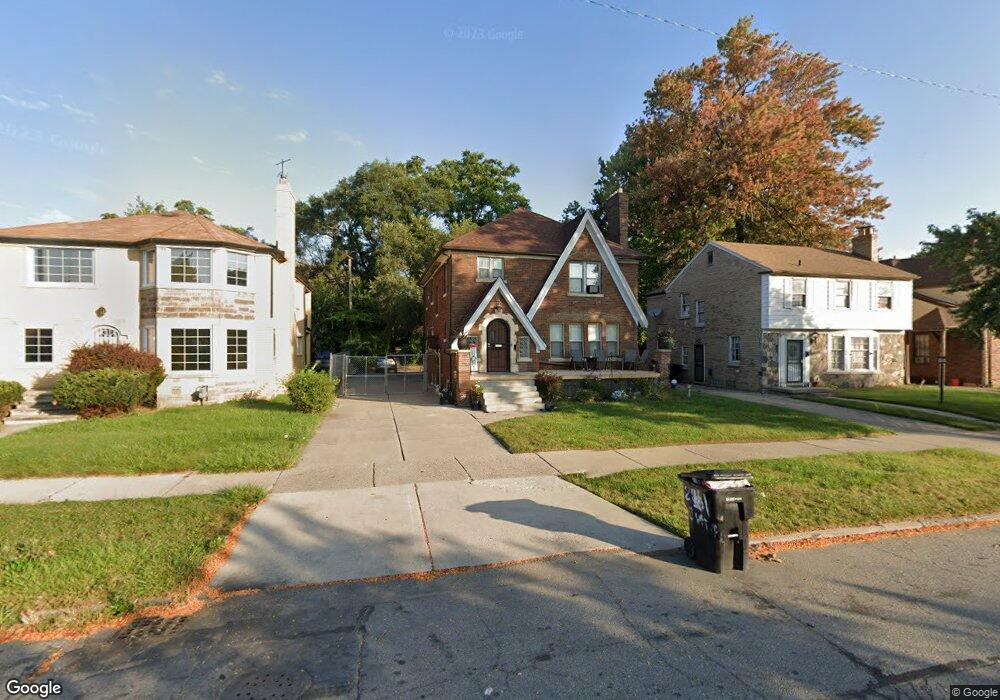
8461 E Outer Dr Detroit, MI 48213
Eden Gardens NeighborhoodEstimated Value: $95,000 - $130,000
4
Beds
2
Baths
1,996
Sq Ft
$57/Sq Ft
Est. Value
About This Home
This home is located at 8461 E Outer Dr, Detroit, MI 48213 and is currently estimated at $114,443, approximately $57 per square foot. 8461 E Outer Dr is a home located in Wayne County with nearby schools including Edward 'Duke' Ellington Conservatory of Music and Art, Charles L. Spain Elementary-Middle School, and Denby High School.
Ownership History
Date
Name
Owned For
Owner Type
Purchase Details
Closed on
Jul 13, 2023
Sold by
Vinson Darius
Bought by
Vinson Darius and Vinson Tracy Denise
Current Estimated Value
Purchase Details
Closed on
Mar 22, 2012
Sold by
Smart Homes Investments Ltd
Bought by
Bowler Andrew John
Purchase Details
Closed on
Nov 22, 2011
Sold by
Wayne County Treasurer
Bought by
Smart Homes Investment Ltd
Purchase Details
Closed on
Nov 18, 2004
Sold by
Barnes Terry
Bought by
Barnes Terry W
Purchase Details
Closed on
Nov 11, 2004
Sold by
Deustche Bank Trust Co Of America
Bought by
National City Mortgage Co
Purchase Details
Closed on
Nov 8, 2004
Sold by
National City Mortgage Co
Bought by
Barnes Terry
Purchase Details
Closed on
May 21, 2003
Sold by
Davis Tony C
Bought by
National City Mortgage Co and Commonwealth United Mortgage Co
Purchase Details
Closed on
May 19, 2003
Sold by
National City Mortgage
Bought by
Deustche Bank Trust Co
Create a Home Valuation Report for This Property
The Home Valuation Report is an in-depth analysis detailing your home's value as well as a comparison with similar homes in the area
Home Values in the Area
Average Home Value in this Area
Purchase History
| Date | Buyer | Sale Price | Title Company |
|---|---|---|---|
| Vinson Darius | -- | None Listed On Document | |
| Bowler Andrew John | $36,000 | Active Title Agency Inc | |
| Smart Homes Investment Ltd | $3,100 | None Available | |
| Barnes Terry W | -- | Great Lakes Title Of Mi | |
| National City Mortgage Co | -- | Great Lakes Title Of Mi | |
| Barnes Terry | $70,000 | Great Lakes Title | |
| National City Mortgage Co | $145,502 | -- | |
| Deustche Bank Trust Co | -- | -- |
Source: Public Records
Tax History
| Year | Tax Paid | Tax Assessment Tax Assessment Total Assessment is a certain percentage of the fair market value that is determined by local assessors to be the total taxable value of land and additions on the property. | Land | Improvement |
|---|---|---|---|---|
| 2025 | $852 | $22,300 | $0 | $0 |
| 2024 | $856 | $19,500 | $0 | $0 |
| 2023 | $829 | $15,700 | $0 | $0 |
| 2022 | $899 | $14,200 | $0 | $0 |
| 2021 | $879 | $10,500 | $0 | $0 |
| 2020 | $870 | $10,100 | $0 | $0 |
| 2019 | $859 | $8,800 | $0 | $0 |
| 2018 | $0 | $7,700 | $0 | $0 |
| 2017 | $105 | $8,500 | $0 | $0 |
| 2016 | $729 | $6,500 | $0 | $0 |
| 2015 | $650 | $6,500 | $0 | $0 |
| 2013 | $3,703 | $37,034 | $0 | $0 |
| 2010 | -- | $54,298 | $1,470 | $52,828 |
Source: Public Records
Map
Nearby Homes
- 8481 E Outer Dr
- 12088 Rosemary St
- 8391 E Outer Dr
- 12092 Promenade St
- 8312 E Outer Dr
- 11856 Kilbourne St
- 12293 Kilbourne St
- 11795 Promenade St
- 11894 Glenfield St
- 12069 Wilfred St
- 12538 Promenade St
- 11790 Wilshire Dr
- 12599 Rosemary St
- 8790 E Outer Dr
- 11299 Rosemary St
- 12614 Promenade St
- 12590 Wilshire Dr
- 12048 Longview St
- 12702 Promenade Ave
- 12328 Longview St
- 8451 E Outer Dr
- 8471 E Outer Dr
- 8441 E Outer Dr
- 12112 Rosemary St
- 12104 Rosemary St
- 8431 E Outer Dr
- 12120 Rosemary St
- 8491 E Outer Dr
- 12094 Rosemary St
- 12126 Rosemary St
- 8421 E Outer Dr
- 12078 Rosemary St
- 12140 Rosemary St
- 12072 Rosemary St
- 8411 E Outer Dr
- 12150 Rosemary St
- 12064 Rosemary St
- 8460 E Outer Dr
- 8450 E Outer Dr
- 8470 E Outer Dr
Your Personal Tour Guide
Ask me questions while you tour the home.