Estimated Value: $386,000 - $471,000
5
Beds
4
Baths
2,654
Sq Ft
$159/Sq Ft
Est. Value
About This Home
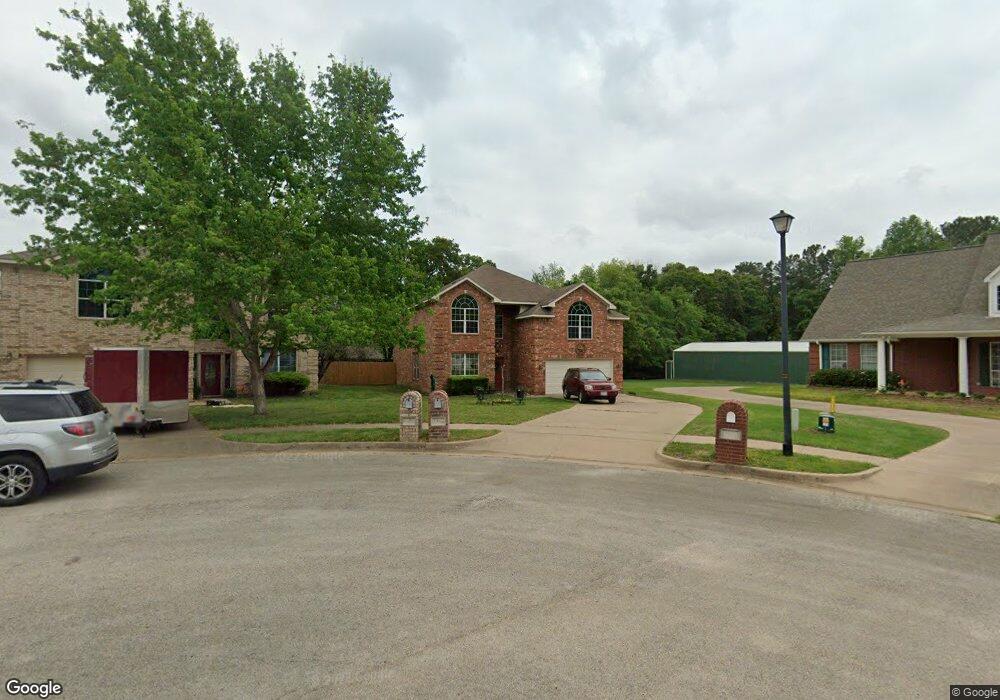
This home is located at 8462 Wilken Plaza, Tyler, TX 75703 and is currently estimated at $420,712, approximately $158 per square foot. 8462 Wilken Plaza is a home located in Smith County with nearby schools including Rice Elementary School, Hubbard Middle School, and Tyler Legacy High School.
Ownership History
Date
Name
Owned For
Owner Type
Purchase Details
Closed on
Oct 27, 2011
Sold by
Fannie Mae
Bought by
Bulls David S
Current Estimated Value
Home Financials for this Owner
Home Financials are based on the most recent Mortgage that was taken out on this home.
Original Mortgage
$168,750
Outstanding Balance
$114,894
Interest Rate
4.14%
Mortgage Type
New Conventional
Estimated Equity
$305,818
Purchase Details
Closed on
Aug 2, 2011
Sold by
Hearn Linda
Bought by
Federal National Mortgage Association and Fannie Mae
Purchase Details
Closed on
Aug 14, 2006
Sold by
Classic Century Homes Ltd
Bought by
Hearn Linda
Home Financials for this Owner
Home Financials are based on the most recent Mortgage that was taken out on this home.
Original Mortgage
$163,730
Interest Rate
6.75%
Mortgage Type
Purchase Money Mortgage
Create a Home Valuation Report for This Property
The Home Valuation Report is an in-depth analysis detailing your home's value as well as a comparison with similar homes in the area
Home Values in the Area
Average Home Value in this Area
Purchase History
| Date | Buyer | Sale Price | Title Company |
|---|---|---|---|
| Bulls David S | -- | Central Title Company | |
| Bulls David S | -- | Central Title Company | |
| Federal National Mortgage Association | $129,200 | None Available | |
| Hearn Linda | -- | None Available | |
| Hearn Linda | -- | None Available |
Source: Public Records
Mortgage History
| Date | Status | Borrower | Loan Amount |
|---|---|---|---|
| Open | Bulls David S | $168,750 | |
| Closed | Bulls David S | $168,750 | |
| Previous Owner | Hearn Linda | $163,730 |
Source: Public Records
Tax History Compared to Growth
Tax History
| Year | Tax Paid | Tax Assessment Tax Assessment Total Assessment is a certain percentage of the fair market value that is determined by local assessors to be the total taxable value of land and additions on the property. | Land | Improvement |
|---|---|---|---|---|
| 2025 | $4,688 | $395,976 | $37,928 | $358,048 |
| 2024 | $4,688 | $335,242 | $49,000 | $390,429 |
| 2023 | $5,313 | $418,986 | $49,000 | $369,986 |
| 2022 | $5,428 | $327,831 | $36,960 | $290,871 |
| 2021 | $5,284 | $251,872 | $36,960 | $214,912 |
| 2020 | $5,344 | $254,089 | $36,960 | $217,129 |
| 2019 | $4,965 | $227,035 | $28,000 | $199,035 |
| 2018 | $4,848 | $222,910 | $28,000 | $194,910 |
| 2017 | $4,532 | $222,910 | $28,000 | $194,910 |
| 2016 | $4,120 | $192,969 | $28,000 | $164,969 |
| 2015 | $3,681 | $189,102 | $28,000 | $161,102 |
| 2014 | $3,681 | $184,860 | $28,000 | $156,860 |
Source: Public Records
Map
Nearby Homes
- 628 Wilder Way
- 6522 Emory Ct
- 8312 Oxford Dr
- 8310 Columbia Dr
- 8307 Garrett Dr
- 419 Wilder Way
- 700 Oxford Dr
- 708 Oxford Cir
- 719 Cambridge Bend Cir
- 308 Canterbury Ct
- 8810 Wilder Trail
- 8811 Wilder Trail
- 8831 Wilder Trail
- 8714 Wilder Trail
- 8702 Wilder Trail
- 8741 Wilder Trail
- 526 Ronnette Dr
- 202 Ronnette Dr
- 1302 Jeff Davis Dr
- 821 Pam Dr
- 8458 Wilken Plaza
- 8458 8458 Wilken Plaza
- 8470 Wilken Plaza
- 8454 Wilken Plaza
- 8421 8421 Castleton
- 8421 Castleton Way
- 8417 Castleton Way
- 8450 Wilken Plaza
- 8450 8450 Wilken Plaza
- 8425 8425 Castleton
- 8425 Castleton Way
- 8461 Wilken Plaza
- 8457 8457 Wilken Plaza
- 8446 Wilken Plaza
- 8413 Castleton Way
- 8457 Wilken Plaza
- 8453 Wilken Plaza
- 8453 8453 Wilken Plaza
- 8449 8449 Wilken Plaza
- 8449 Wilken Plaza