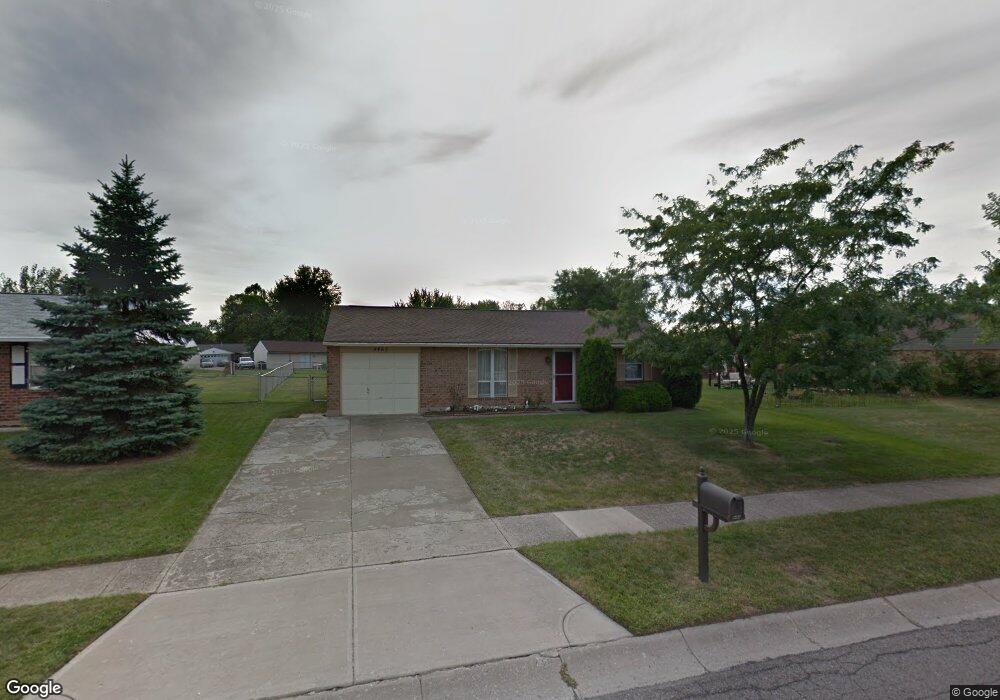
8465 Schoolgate Dr Dayton, OH 45424
Estimated Value: $141,000 - $172,000
2
Beds
1
Bath
918
Sq Ft
$173/Sq Ft
Est. Value
About This Home
This home is located at 8465 Schoolgate Dr, Dayton, OH 45424 and is currently estimated at $159,060, approximately $173 per square foot. 8465 Schoolgate Dr is a home located in Montgomery County with nearby schools including Wayne High School and Huber Heights Christian Academy.
Ownership History
Date
Name
Owned For
Owner Type
Purchase Details
Closed on
Apr 27, 2021
Sold by
Sidor Lora Bragg and Sidor Gregory J
Bought by
Bayberry Rentals Llc
Current Estimated Value
Purchase Details
Closed on
Oct 4, 2013
Sold by
Sidor Lora Bragg and Sidor Lora Bragg
Bought by
Sidor Lora Bragg and Sidor Gregory J
Home Financials for this Owner
Home Financials are based on the most recent Mortgage that was taken out on this home.
Original Mortgage
$58,700
Interest Rate
4.58%
Mortgage Type
Future Advance Clause Open End Mortgage
Purchase Details
Closed on
Aug 25, 2003
Sold by
Vogeler Clarence R
Bought by
Bragg Lora L
Home Financials for this Owner
Home Financials are based on the most recent Mortgage that was taken out on this home.
Original Mortgage
$66,720
Interest Rate
6.49%
Mortgage Type
Purchase Money Mortgage
Purchase Details
Closed on
Oct 12, 1993
Sold by
Mcclary John M and Mcclary Dawn M
Bought by
Vogeler Ii Clarence R
Create a Home Valuation Report for This Property
The Home Valuation Report is an in-depth analysis detailing your home's value as well as a comparison with similar homes in the area
Home Values in the Area
Average Home Value in this Area
Purchase History
| Date | Buyer | Sale Price | Title Company |
|---|---|---|---|
| Bayberry Rentals Llc | $112,000 | Landmark Ttl Agcy South Inc | |
| Sidor Lora Bragg | -- | None Available | |
| Bragg Lora L | $83,400 | -- | |
| Vogeler Ii Clarence R | -- | Landmark Title |
Source: Public Records
Mortgage History
| Date | Status | Borrower | Loan Amount |
|---|---|---|---|
| Previous Owner | Sidor Lora Bragg | $58,700 | |
| Previous Owner | Bragg Lora L | $66,720 |
Source: Public Records
Tax History
| Year | Tax Paid | Tax Assessment Tax Assessment Total Assessment is a certain percentage of the fair market value that is determined by local assessors to be the total taxable value of land and additions on the property. | Land | Improvement |
|---|---|---|---|---|
| 2025 | $2,471 | $45,520 | $12,740 | $32,780 |
| 2024 | $2,388 | $45,520 | $12,740 | $32,780 |
| 2023 | $2,388 | $45,520 | $12,740 | $32,780 |
| 2022 | $2,185 | $32,520 | $9,100 | $23,420 |
| 2021 | $2,192 | $32,520 | $9,100 | $23,420 |
| 2020 | $2,194 | $32,520 | $9,100 | $23,420 |
| 2019 | $2,153 | $28,220 | $9,100 | $19,120 |
| 2018 | $2,160 | $28,220 | $9,100 | $19,120 |
| 2017 | $2,147 | $28,220 | $9,100 | $19,120 |
| 2016 | $2,038 | $26,810 | $9,100 | $17,710 |
| 2015 | $2,012 | $26,810 | $9,100 | $17,710 |
| 2014 | $2,012 | $26,810 | $9,100 | $17,710 |
| 2012 | -- | $25,460 | $9,100 | $16,360 |
Source: Public Records
Map
Nearby Homes
- 6065 Shull Rd
- 6334 Shull Rd
- 6375 Greenfield Way
- 6070 Charlesgate Rd
- 6350 Charlotte Ct
- 8286 Briar Ridge Ct
- 8871 Willowgate Ln
- 8767 Deer Valley Dr
- 7999 Blackshear Dr
- 8969 Gardengate Dr
- 5770 Charlesgate Rd
- 8918 Autumngate Ln
- 8851 Cherrygate Ct
- 8930 Century Ln
- 6501 Stonehurst Dr
- 6613 Loblolly Dr
- 5686 Firegate Ct
- 5769 Waynegate Rd
- 7619 Bassett Dr
- 3198 White Ash Dr
- 8457 Schoolgate Dr
- 6158 Moss Hill Ct
- 6150 Moss Hill Ct
- 6151 Little Creek Ct
- 8449 Schoolgate Dr
- 6157 Little Creek Ct
- 8466 Schoolgate Dr
- 6142 Moss Hill Ct
- 8458 Schoolgate Dr
- 8474 Schoolgate Dr
- 6153 Green Knolls Dr
- 6165 Little Creek Ct
- 8450 Schoolgate Dr
- 6134 Moss Hill Ct
- 8482 Schoolgate Dr
- 6143 Little Creek Ct
- 8489 Schoolgate Dr
- 6171 Little Creek Ct
- 6151 Moss Hill Ct
- 6176 Pine Point Place
Your Personal Tour Guide
Ask me questions while you tour the home.