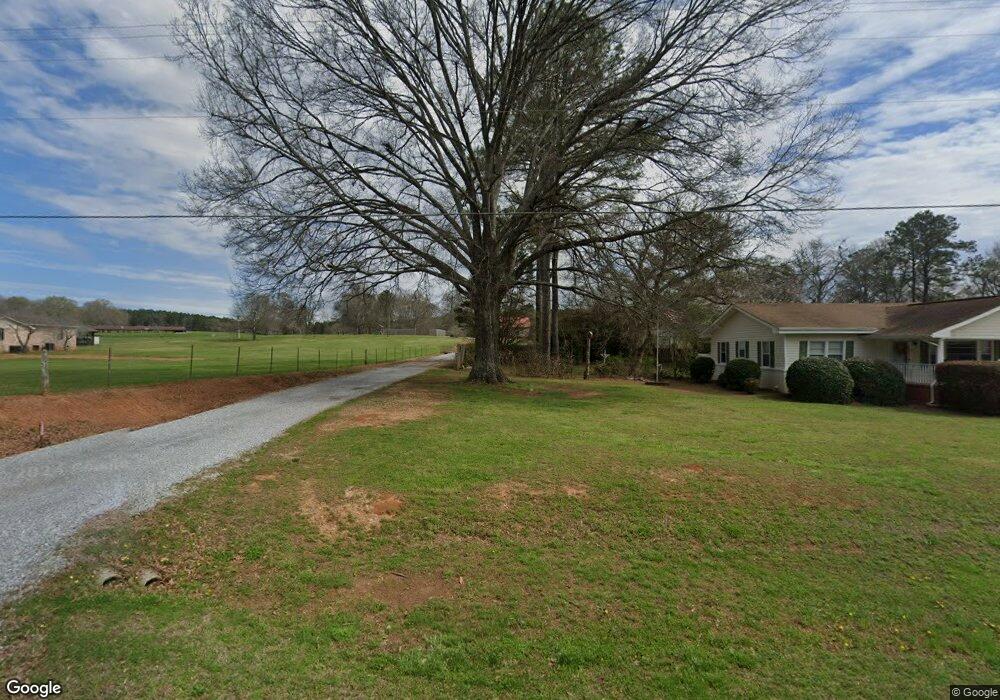
847 Antioch Rd Cedartown, GA 30125
Estimated Value: $189,000 - $242,000
3
Beds
2
Baths
1,444
Sq Ft
$148/Sq Ft
Est. Value
About This Home
This home is located at 847 Antioch Rd, Cedartown, GA 30125 and is currently estimated at $214,342, approximately $148 per square foot. 847 Antioch Rd is a home located in Polk County with nearby schools including Cedar Christian School.
Ownership History
Date
Name
Owned For
Owner Type
Purchase Details
Closed on
Sep 5, 2025
Sold by
Norris Julian Christopher
Bought by
Norris Julian Christopher and Johnson Timberly
Current Estimated Value
Home Financials for this Owner
Home Financials are based on the most recent Mortgage that was taken out on this home.
Original Mortgage
$53,000
Outstanding Balance
$52,688
Interest Rate
6.63%
Mortgage Type
New Conventional
Estimated Equity
$161,654
Purchase Details
Closed on
Jul 10, 2025
Sold by
Norris Julian Christopher
Bought by
Norris Julian Christopher and Johnson Timberly
Home Financials for this Owner
Home Financials are based on the most recent Mortgage that was taken out on this home.
Original Mortgage
$53,000
Outstanding Balance
$52,688
Interest Rate
6.63%
Mortgage Type
New Conventional
Estimated Equity
$161,654
Purchase Details
Closed on
Jun 9, 1995
Sold by
Norris Julian Mancel and Norris Joanne
Bought by
Johnson Timothy S and Johnson Angela H
Create a Home Valuation Report for This Property
The Home Valuation Report is an in-depth analysis detailing your home's value as well as a comparison with similar homes in the area
Home Values in the Area
Average Home Value in this Area
Purchase History
| Date | Buyer | Sale Price | Title Company |
|---|---|---|---|
| Norris Julian Christopher | -- | -- | |
| Norris Julian Christopher | -- | -- | |
| Johnson Timothy S | -- | -- |
Source: Public Records
Mortgage History
| Date | Status | Borrower | Loan Amount |
|---|---|---|---|
| Open | Norris Julian Christopher | $53,000 |
Source: Public Records
Tax History Compared to Growth
Tax History
| Year | Tax Paid | Tax Assessment Tax Assessment Total Assessment is a certain percentage of the fair market value that is determined by local assessors to be the total taxable value of land and additions on the property. | Land | Improvement |
|---|---|---|---|---|
| 2024 | $1,269 | $60,727 | $2,308 | $58,419 |
| 2023 | $945 | $39,799 | $2,308 | $37,491 |
| 2022 | $803 | $33,821 | $1,538 | $32,283 |
| 2021 | $813 | $33,821 | $1,538 | $32,283 |
| 2020 | $815 | $33,821 | $1,538 | $32,283 |
| 2019 | $774 | $28,817 | $1,538 | $27,279 |
| 2018 | $776 | $28,144 | $1,538 | $26,606 |
| 2017 | $766 | $28,144 | $1,538 | $26,606 |
| 2016 | $804 | $29,535 | $2,928 | $26,606 |
| 2015 | $512 | $18,750 | $2,928 | $15,822 |
| 2014 | $461 | $18,750 | $2,928 | $15,822 |
Source: Public Records
Map
Nearby Homes
- 766 Antioch Rd
- 255 Mildred Dr
- 480 Cason Rd
- 35 Old Mill Rd
- 1987 Buchanan Hwy
- 95 Wieuca Way
- 00 Buchanan Hwy
- 142 Acres On Judkin Mill Rd
- 000 Wieuca Way
- 240 Benedict Loop
- 0 Wieuca Way Unit 10614129
- 160 Tate Rd
- 203 Cason Rd
- 117 Cason Rd
- 205 Pinecrest Rd
- 0 Coaling Rd Unit 9221-D 10352096
- 0 Coaling Rd Unit 9221-C 10352086
- 0 Coaling Rd Unit 9221 10352063
- 0 Coaling Rd Unit 9221-B 10352079
- 9236 Tallapoosa Hwy
- 859 Antioch Rd
- 825 Antioch Rd
- 825 Antioch Rd
- 873 Antioch Rd
- 860 Antioch Rd
- 830 Antioch Rd
- 791 Antioch Rd
- 880 Antioch Rd
- 897 Cason Rd
- 783 Antioch Rd
- 732 Antioch Rd
- 765 Antioch Rd
- 929 Antioch Rd
- 790 1/2 Antioch Rd
- 790 Antioch Rd
- 781 Antioch Rd
- 782 Antioch Rd
- 776 Antioch Rd
- 753 Antioch Rd
- 743 Antioch Rd