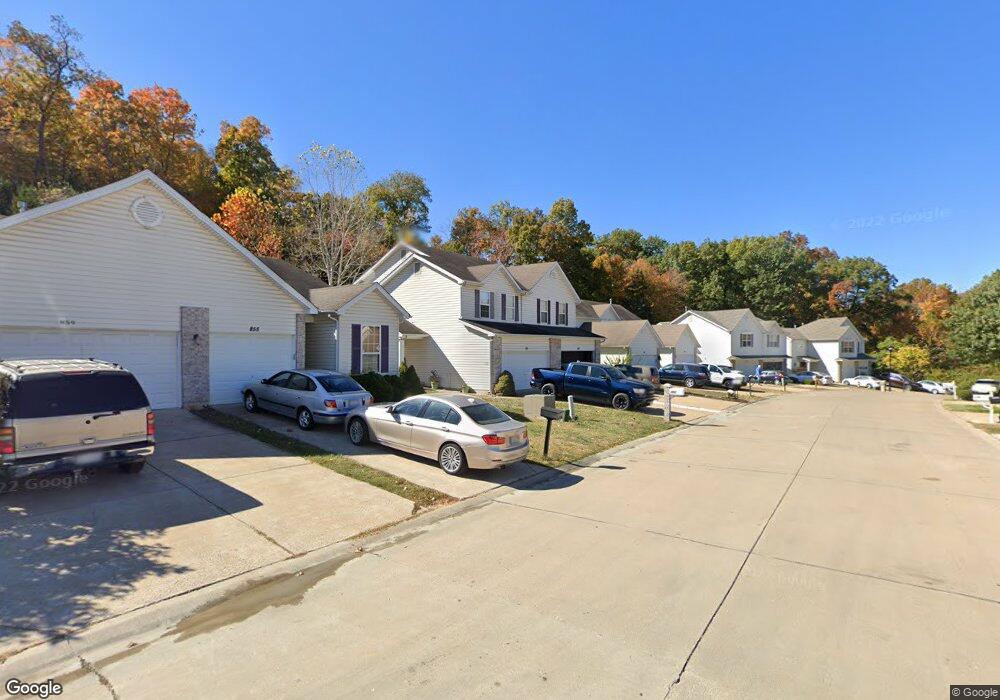
847 Caleb Crossing Fenton, MO 63026
Estimated Value: $232,000 - $272,000
3
Beds
3
Baths
862
Sq Ft
$283/Sq Ft
Est. Value
About This Home
This home is located at 847 Caleb Crossing, Fenton, MO 63026 and is currently estimated at $244,066, approximately $283 per square foot. 847 Caleb Crossing is a home located in Jefferson County with nearby schools including Meramec Heights Elementary School, Ridgewood Middle School, and Fox Senior High School.
Ownership History
Date
Name
Owned For
Owner Type
Purchase Details
Closed on
Sep 29, 2017
Sold by
Weygandt Vernon P and Weygandt Patricia A
Bought by
Golden Ronald E and Golden Rachelle D
Current Estimated Value
Home Financials for this Owner
Home Financials are based on the most recent Mortgage that was taken out on this home.
Original Mortgage
$122,735
Outstanding Balance
$102,077
Interest Rate
3.75%
Mortgage Type
FHA
Estimated Equity
$141,989
Purchase Details
Closed on
Jan 25, 2012
Sold by
Strong Lana and Strong Lawrence
Bought by
Weygandt Vernon P and Weygandt Patricia A
Purchase Details
Closed on
Jan 6, 2006
Sold by
Travis Shane Homes Inc
Bought by
Strong Lana
Home Financials for this Owner
Home Financials are based on the most recent Mortgage that was taken out on this home.
Original Mortgage
$124,900
Interest Rate
6.18%
Mortgage Type
Fannie Mae Freddie Mac
Create a Home Valuation Report for This Property
The Home Valuation Report is an in-depth analysis detailing your home's value as well as a comparison with similar homes in the area
Home Values in the Area
Average Home Value in this Area
Purchase History
| Date | Buyer | Sale Price | Title Company |
|---|---|---|---|
| Golden Ronald E | -- | None Available | |
| Weygandt Vernon P | -- | Ctc | |
| Strong Lana | -- | Commonwealth Land Title |
Source: Public Records
Mortgage History
| Date | Status | Borrower | Loan Amount |
|---|---|---|---|
| Open | Golden Ronald E | $122,735 | |
| Previous Owner | Strong Lana | $124,900 |
Source: Public Records
Tax History Compared to Growth
Tax History
| Year | Tax Paid | Tax Assessment Tax Assessment Total Assessment is a certain percentage of the fair market value that is determined by local assessors to be the total taxable value of land and additions on the property. | Land | Improvement |
|---|---|---|---|---|
| 2025 | $2,242 | $34,800 | $4,000 | $30,800 |
| 2024 | $2,242 | $30,600 | $3,600 | $27,000 |
| 2023 | $2,242 | $30,600 | $3,600 | $27,000 |
| 2022 | $2,246 | $30,600 | $3,600 | $27,000 |
| 2021 | $2,244 | $30,600 | $3,600 | $27,000 |
| 2020 | $2,104 | $27,000 | $3,100 | $23,900 |
| 2019 | $2,106 | $27,000 | $3,100 | $23,900 |
| 2018 | $2,099 | $27,000 | $3,100 | $23,900 |
| 2017 | $2,036 | $27,000 | $3,100 | $23,900 |
| 2016 | $1,869 | $24,900 | $3,100 | $21,800 |
| 2015 | $1,808 | $24,900 | $3,100 | $21,800 |
| 2013 | -- | $23,400 | $3,100 | $20,300 |
Source: Public Records
Map
Nearby Homes
- 223 Cool Valley Dr
- 601 Northview Dr
- 5034 Corisande Woods Dr
- 2323 Konert Rd
- 1589 Sparrow Point Ln
- 1102 Silverwillow Ct
- 615 Corisande Hill Rd
- 5065 Romaine Spring Dr
- 714 Winding Bluffs Dr
- 78 Konert Cir
- 802 Fox Creek Dr
- 732 Konert Crossing
- 711 Turnbridge Dr
- 943 Shadow Pine Dr
- 990 Hydeaway Ct
- 314 Romaine Spring View
- 15 Waybridge Ct
- 140 Fenton Crossing
- 2751 Winding Valley Dr
- 317 Winding Bluffs Ct
- 851 Caleb Crossing
- 843 Caleb Crossing
- 855 Caleb Crossing
- 839 Caleb Crossing
- 859 Caleb Crossing
- 835 Caleb Crossing
- 835 Caleb Crossing
- 863 Caleb Crossing
- 831 Caleb Crossing
- 846 Caleb Crossing
- 840 Caleb Crossing
- 856 Caleb Crossing
- 867 Caleb Crossing
- 852 Caleb Crossing
- 860 Caleb Crossing
- 827 Caleb Crossing
- 871 Caleb Crossing
- 866 Caleb Crossing
- 823 Caleb Crossing
- 879 Caleb Crossing