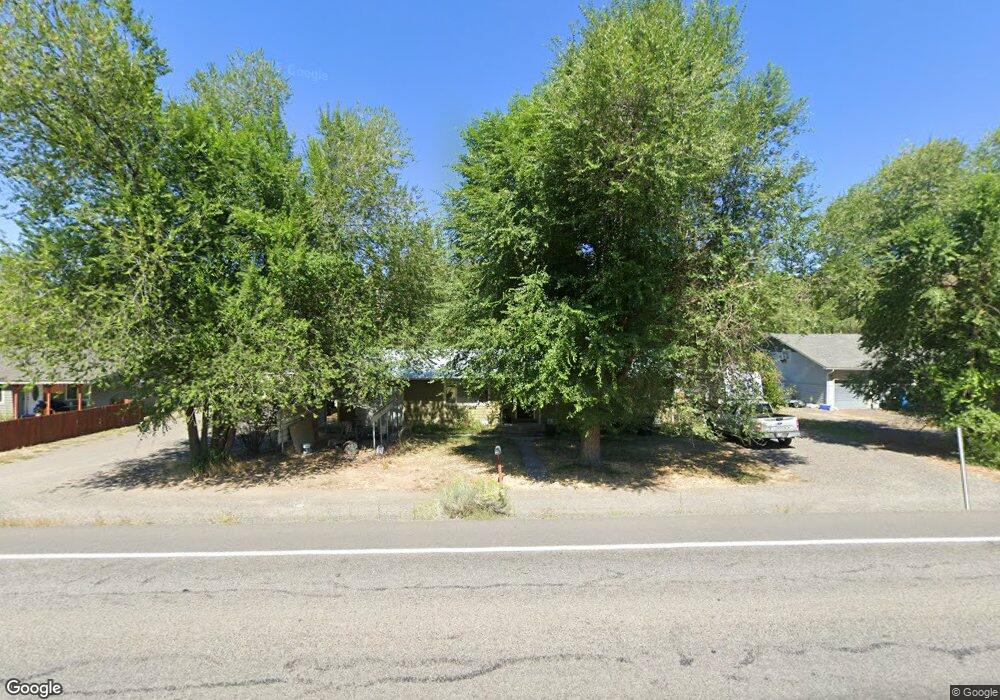
847 E Main St John Day, OR 97845
Estimated Value: $139,000 - $269,611
--
Bed
--
Bath
1,586
Sq Ft
$138/Sq Ft
Est. Value
About This Home
This home is located at 847 E Main St, John Day, OR 97845 and is currently estimated at $218,153, approximately $137 per square foot. 847 E Main St is a home located in Grant County with nearby schools including Grant Union Junior/Senior High School.
Ownership History
Date
Name
Owned For
Owner Type
Purchase Details
Closed on
Jul 30, 2020
Sold by
Traughber Farrell C and The Trust Of Janyce A Bond
Bought by
Blackburn Garrett J
Current Estimated Value
Home Financials for this Owner
Home Financials are based on the most recent Mortgage that was taken out on this home.
Original Mortgage
$135,000
Interest Rate
3.1%
Mortgage Type
Commercial
Purchase Details
Closed on
Jul 29, 2020
Sold by
Traughber Ryan
Bought by
Blackburn Garrett J
Home Financials for this Owner
Home Financials are based on the most recent Mortgage that was taken out on this home.
Original Mortgage
$135,000
Interest Rate
3.1%
Mortgage Type
Commercial
Create a Home Valuation Report for This Property
The Home Valuation Report is an in-depth analysis detailing your home's value as well as a comparison with similar homes in the area
Home Values in the Area
Average Home Value in this Area
Purchase History
| Date | Buyer | Sale Price | Title Company |
|---|---|---|---|
| Blackburn Garrett J | $135,000 | Amerititle | |
| Blackburn Garrett J | $135,000 | Amerititle | |
| Blackburn Garrett J | $135,000 | Amerititle |
Source: Public Records
Mortgage History
| Date | Status | Borrower | Loan Amount |
|---|---|---|---|
| Closed | Blackburn Garrett J | $135,000 |
Source: Public Records
Tax History Compared to Growth
Tax History
| Year | Tax Paid | Tax Assessment Tax Assessment Total Assessment is a certain percentage of the fair market value that is determined by local assessors to be the total taxable value of land and additions on the property. | Land | Improvement |
|---|---|---|---|---|
| 2024 | $275 | $18,170 | $18,170 | $115,162 |
| 2023 | $267 | $17,641 | $17,641 | $111,808 |
| 2022 | $259 | $17,128 | $17,128 | $110,120 |
| 2021 | $1,567 | $102,687 | $36,421 | $66,266 |
| 2020 | $1,642 | $99,697 | $35,363 | $64,334 |
| 2019 | $1,590 | $96,794 | $35,247 | $61,547 |
| 2018 | $1,550 | $93,975 | $34,216 | $59,759 |
| 2017 | $1,512 | $91,238 | $33,221 | $58,017 |
| 2016 | $1,380 | $88,581 | $32,254 | $56,327 |
| 2015 | $1,380 | $83,497 | $30,403 | $53,094 |
| 2014 | $1,380 | $83,497 | $30,403 | $53,094 |
| 2013 | $1,292 | $81,066 | $29,734 | $51,332 |
Source: Public Records
Map
Nearby Homes
- 858 E Main St
- 798 E Main St
- 748 E Main St
- 600 SE 2nd Ave
- 520 SE Hillcrest Rd
- 100 SE Hillcrest Rd
- 801 Ferguson Rd
- 304 SE Hillcrest Dr
- 250 E Main St
- 250 NE Dayton St
- 173 N Canyon Blvd
- 310 N Canyon Blvd
- 0 NE 7th St
- 312 N Canyon Blvd
- 318 SW Brent Dr
- 212 NW Bridge St
- 128 SW Canton St
- 410 NW Bridge St
- 0 Blue Gulch Rd
- 227 NW 2nd Ave