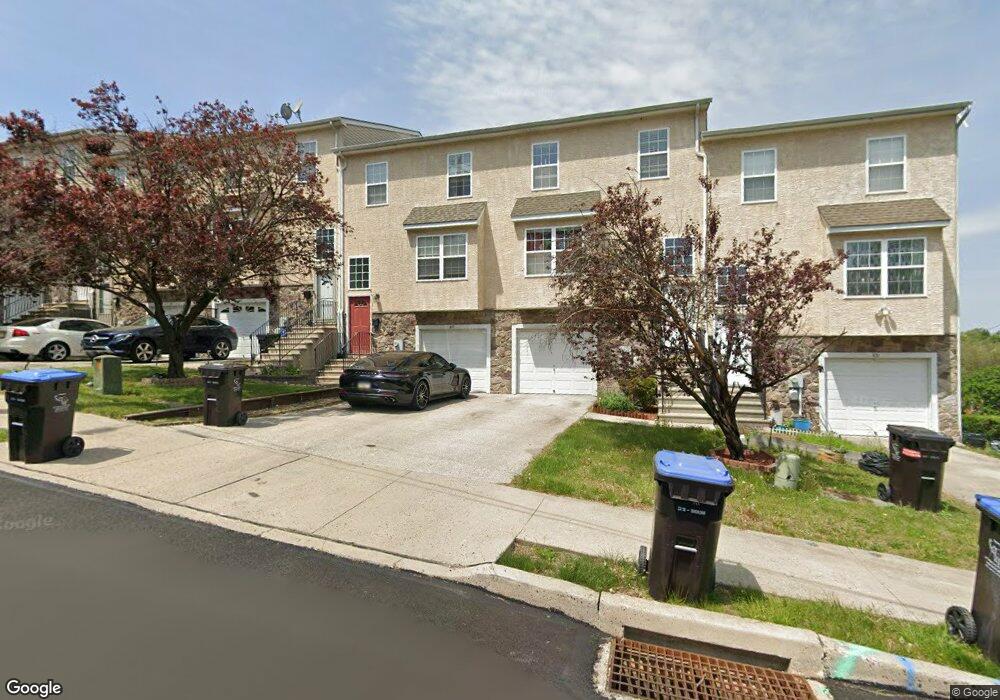
847 High St Norristown, PA 19401
Estimated Value: $218,000 - $331,000
3
Beds
2
Baths
2,009
Sq Ft
$149/Sq Ft
Est. Value
About This Home
This home is located at 847 High St, Norristown, PA 19401 and is currently estimated at $298,897, approximately $148 per square foot. 847 High St is a home located in Montgomery County with nearby schools including Charles Blockson Middle School, Cole Manor Elementary School, and East Norriton Middle School.
Ownership History
Date
Name
Owned For
Owner Type
Purchase Details
Closed on
Dec 12, 2018
Sold by
Wells Fargo Bank
Bought by
Lui Eric Man
Current Estimated Value
Purchase Details
Closed on
Sep 25, 2018
Sold by
Montgomery County Sheriff
Bought by
Wells Fargo Bank
Purchase Details
Closed on
Aug 21, 2007
Sold by
Mlingo Afrika and Mlingo Vusa
Bought by
Devereux Jessica and Krumenacker Michael
Home Financials for this Owner
Home Financials are based on the most recent Mortgage that was taken out on this home.
Original Mortgage
$218,150
Interest Rate
6.7%
Purchase Details
Closed on
Jan 10, 2006
Sold by
Fazio Prop Llc
Bought by
Mlingo Vusa and Mlingo Afrika
Home Financials for this Owner
Home Financials are based on the most recent Mortgage that was taken out on this home.
Original Mortgage
$41,180
Interest Rate
6.34%
Create a Home Valuation Report for This Property
The Home Valuation Report is an in-depth analysis detailing your home's value as well as a comparison with similar homes in the area
Home Values in the Area
Average Home Value in this Area
Purchase History
| Date | Buyer | Sale Price | Title Company |
|---|---|---|---|
| Lui Eric Man | $130,000 | Boston National Title | |
| Wells Fargo Bank | $1,658 | None Available | |
| Devereux Jessica | $219,900 | None Available | |
| Mlingo Vusa | $205,900 | None Available |
Source: Public Records
Mortgage History
| Date | Status | Borrower | Loan Amount |
|---|---|---|---|
| Previous Owner | Devereux Jessica | $218,150 | |
| Previous Owner | Mlingo Vusa | $41,180 | |
| Previous Owner | Mlingo Vusa | $164,720 |
Source: Public Records
Tax History Compared to Growth
Tax History
| Year | Tax Paid | Tax Assessment Tax Assessment Total Assessment is a certain percentage of the fair market value that is determined by local assessors to be the total taxable value of land and additions on the property. | Land | Improvement |
|---|---|---|---|---|
| 2025 | $6,589 | $107,330 | -- | -- |
| 2024 | $6,589 | $107,330 | -- | -- |
| 2023 | $6,530 | $107,330 | $0 | $0 |
| 2022 | $6,388 | $107,330 | $0 | $0 |
| 2021 | $6,357 | $107,330 | $0 | $0 |
| 2020 | $6,064 | $107,330 | $0 | $0 |
| 2019 | $5,953 | $107,330 | $0 | $0 |
| 2018 | $3,963 | $107,330 | $0 | $0 |
| 2017 | $5,467 | $107,330 | $0 | $0 |
| 2016 | $5,425 | $107,330 | $0 | $0 |
| 2015 | $5,197 | $107,330 | $0 | $0 |
| 2014 | $5,197 | $107,330 | $0 | $0 |
Source: Public Records
Map
Nearby Homes