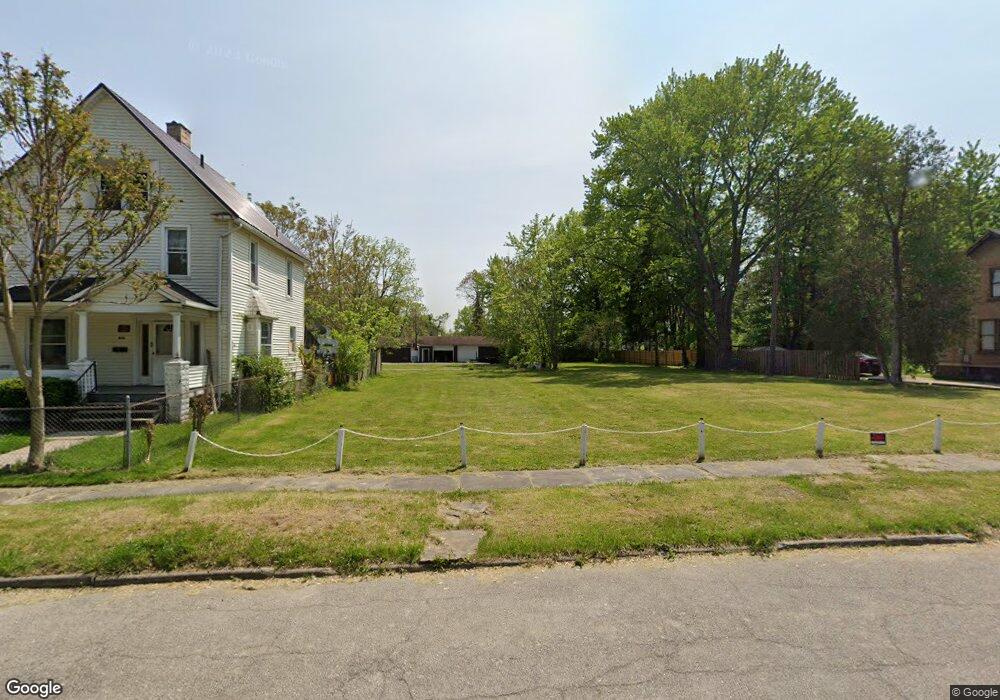
847 Hunter St NW Warren, OH 44485
Amvets NeighborhoodEstimated Value: $28,000 - $73,000
3
Beds
2
Baths
1,356
Sq Ft
$40/Sq Ft
Est. Value
About This Home
This home is located at 847 Hunter St NW, Warren, OH 44485 and is currently estimated at $54,667, approximately $40 per square foot. 847 Hunter St NW is a home located in Trumbull County with nearby schools including Warren G. Harding High School, Willard PK-8 School, and Steam Academy of Warren.
Ownership History
Date
Name
Owned For
Owner Type
Purchase Details
Closed on
Aug 2, 2022
Sold by
Trumbull County Land Reutilization Corpo
Bought by
Harvey Robert
Current Estimated Value
Purchase Details
Closed on
Nov 15, 2019
Sold by
Timelme Investment Group Llc
Bought by
Trumbull County Land Reutilization Corp
Purchase Details
Closed on
Nov 22, 2016
Sold by
Providence Assets Llc
Bought by
Timeline Investment Group Llc
Purchase Details
Closed on
Mar 30, 2015
Sold by
Coleman Kevin D
Bought by
Wells Fargo Bank Na
Purchase Details
Closed on
Mar 14, 2011
Sold by
Coleman Kevin D
Bought by
Lorraine Rhonda L
Purchase Details
Closed on
Jan 14, 2000
Sold by
Durch Dorothy D and Bettiker Dorothy
Bought by
Lorraine Rhonda
Home Financials for this Owner
Home Financials are based on the most recent Mortgage that was taken out on this home.
Original Mortgage
$41,250
Interest Rate
7.89%
Purchase Details
Closed on
Jan 1, 1990
Bought by
Dorothy D Durch
Create a Home Valuation Report for This Property
The Home Valuation Report is an in-depth analysis detailing your home's value as well as a comparison with similar homes in the area
Home Values in the Area
Average Home Value in this Area
Purchase History
| Date | Buyer | Sale Price | Title Company |
|---|---|---|---|
| Harvey Robert | -- | Rieger Gilbert L | |
| Trumbull County Land Reutilization Corp | -- | None Available | |
| Timeline Investment Group Llc | $13,700 | None Available | |
| Wells Fargo Bank Na | $3,000 | None Available | |
| Lorraine Rhonda L | -- | Attorney | |
| Lorraine Rhonda | $37,175 | -- | |
| Dorothy D Durch | -- | -- |
Source: Public Records
Mortgage History
| Date | Status | Borrower | Loan Amount |
|---|---|---|---|
| Previous Owner | Lorraine Rhonda | $41,250 |
Source: Public Records
Tax History Compared to Growth
Tax History
| Year | Tax Paid | Tax Assessment Tax Assessment Total Assessment is a certain percentage of the fair market value that is determined by local assessors to be the total taxable value of land and additions on the property. | Land | Improvement |
|---|---|---|---|---|
| 2024 | $11 | $210 | $210 | $0 |
| 2023 | $11 | $210 | $210 | $0 |
| 2022 | $14 | $210 | $210 | $0 |
| 2021 | $14 | $210 | $210 | $0 |
| 2020 | $153 | $2,350 | $1,020 | $1,330 |
| 2019 | $264 | $2,280 | $1,020 | $1,260 |
| 2018 | $151 | $2,280 | $1,020 | $1,260 |
| 2017 | $149 | $2,280 | $1,020 | $1,260 |
| 2016 | $303 | $4,800 | $1,400 | $3,400 |
| 2015 | $301 | $4,800 | $1,400 | $3,400 |
| 2014 | $299 | $4,800 | $1,400 | $3,400 |
| 2013 | $305 | $5,150 | $1,400 | $3,750 |
Source: Public Records
Map
Nearby Homes
- 600 Parkman Rd NW
- 806 Parkman Rd NW
- 970 Tod Ave NW
- 666 Dickey Ave NW
- 983 Garden St NW
- 561 South St SW
- 1056 Orlo Dr NW
- 1166 Raymond St NW
- 855 Adams Ave NW
- 759 Tod Ave SW
- 360 Freeman St NW
- 428 Waverly Ave NE
- 1325 Moncrest Dr NW
- 555 Hall St NW
- 1447 Grove Ave NW
- 1459 West Ave NW
- 433 Olive Ave NE Unit 435
- 1530 Vernon Ave NW
- 442 Belmont Ave NE
- 1552 Denison Ave NW
- 839 Hunter St NW
- 857 Hunter St NW
- 829 Hunter St NW
- 867 Hunter St NW
- 821 Hunter St NW
- 877 Hunter St NW
- 840 Hunter St NW
- 832 Utica Ct NW
- 832 Utica Ct NW
- 848 Hunter St NW Unit 440
- 848 Hunter St NW
- 369 Tod Ave NW
- 840 Utica Ct NW
- 846 Hunter St NW
- 856 Hunter St NW
- 383 Tod Ave NW
- 885 Hunter St NW
- 864 Hunter St NW
- 521 Tod Ave NW
- 894 Hunter St NW