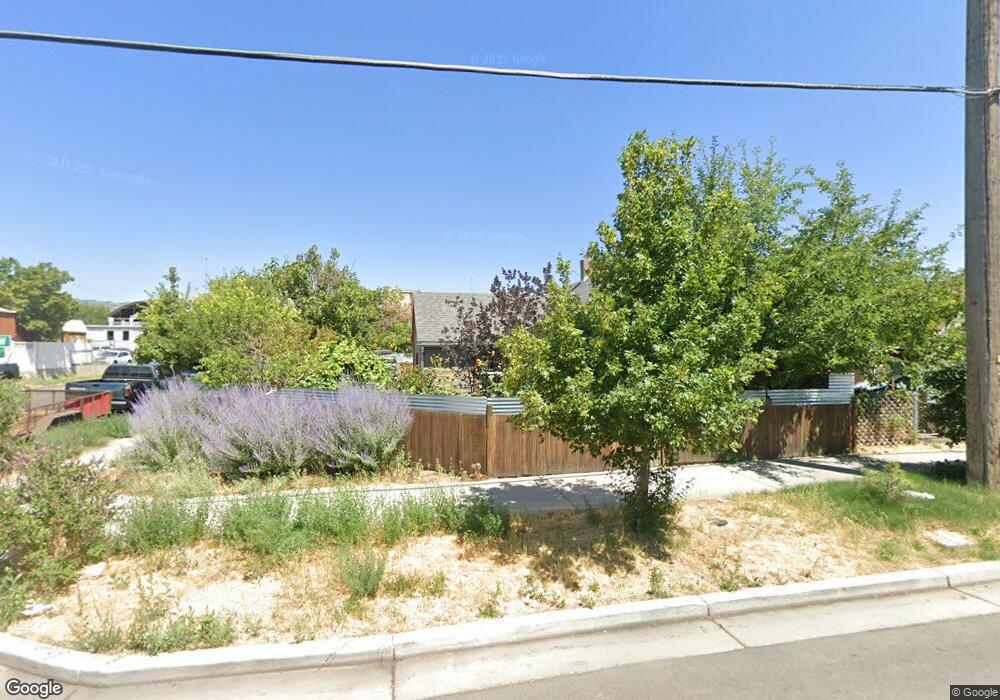
847 S 800 W Salt Lake City, UT 84104
Poplar Grove NeighborhoodEstimated Value: $307,000 - $338,000
2
Beds
1
Bath
798
Sq Ft
$405/Sq Ft
Est. Value
About This Home
This home is located at 847 S 800 W, Salt Lake City, UT 84104 and is currently estimated at $323,431, approximately $405 per square foot. 847 S 800 W is a home located in Salt Lake County with nearby schools including Riley Elementary School, Glendale Middle, and Highland High School.
Ownership History
Date
Name
Owned For
Owner Type
Purchase Details
Closed on
Mar 18, 2019
Sold by
Framme Lawrence H
Bought by
Framme Lawrence H
Current Estimated Value
Home Financials for this Owner
Home Financials are based on the most recent Mortgage that was taken out on this home.
Original Mortgage
$152,000
Outstanding Balance
$133,634
Interest Rate
4.4%
Mortgage Type
New Conventional
Estimated Equity
$189,797
Purchase Details
Closed on
Feb 21, 2017
Sold by
Chapin Sarah S and Knight Tanner J
Bought by
Framme Lawrence H
Home Financials for this Owner
Home Financials are based on the most recent Mortgage that was taken out on this home.
Original Mortgage
$131,338
Interest Rate
4.19%
Mortgage Type
New Conventional
Purchase Details
Closed on
Sep 26, 2012
Sold by
Chapin Sarah S
Bought by
Chapin Sarah S and Knight Tanner J
Home Financials for this Owner
Home Financials are based on the most recent Mortgage that was taken out on this home.
Original Mortgage
$62,400
Interest Rate
3.58%
Mortgage Type
New Conventional
Purchase Details
Closed on
Sep 25, 2012
Sold by
Church David E
Bought by
Chapin Sarah S
Home Financials for this Owner
Home Financials are based on the most recent Mortgage that was taken out on this home.
Original Mortgage
$62,400
Interest Rate
3.58%
Mortgage Type
New Conventional
Purchase Details
Closed on
Oct 25, 2004
Sold by
Ramos Christopher M
Bought by
Church David E
Home Financials for this Owner
Home Financials are based on the most recent Mortgage that was taken out on this home.
Original Mortgage
$64,800
Interest Rate
6.12%
Mortgage Type
Stand Alone First
Purchase Details
Closed on
Dec 23, 2003
Sold by
Bank Of New York
Bought by
Ramos Christopher M
Purchase Details
Closed on
Nov 12, 2003
Sold by
Burson Fred K and Burson Eleanor Z
Bought by
Bank Of New York and Pooling & Servicing Agreement Tr Series
Purchase Details
Closed on
Nov 3, 1998
Sold by
Countrywide Home Loans
Bought by
Hud
Purchase Details
Closed on
Oct 18, 1994
Sold by
Poulson Gordon
Bought by
Telford Jim L
Purchase Details
Closed on
Jun 16, 1994
Sold by
Beddick Linda M
Bought by
Beddick Linda Marie
Create a Home Valuation Report for This Property
The Home Valuation Report is an in-depth analysis detailing your home's value as well as a comparison with similar homes in the area
Home Values in the Area
Average Home Value in this Area
Purchase History
| Date | Buyer | Sale Price | Title Company |
|---|---|---|---|
| Framme Lawrence H | -- | Vanguard Title Ins Agcy | |
| Framme Lawrence H | -- | Titan Title Ins Agency Inc | |
| Chapin Sarah S | -- | Moument Titel Ins Co | |
| Chapin Sarah S | -- | Absolute Title Ins Agency In | |
| Church David E | -- | First American Title | |
| Ramos Christopher M | -- | First American Title | |
| Bank Of New York | $52,000 | -- | |
| Hud | -- | Backman Stewart Title Servic | |
| Telford Jim L | -- | -- | |
| Beddick Linda Marie | -- | -- | |
| Beddick Linda Marie | -- | -- |
Source: Public Records
Mortgage History
| Date | Status | Borrower | Loan Amount |
|---|---|---|---|
| Open | Framme Lawrence H | $152,000 | |
| Closed | Framme Lawrence H | $131,338 | |
| Previous Owner | Chapin Sarah S | $62,400 | |
| Previous Owner | Church David E | $64,800 | |
| Closed | Church David E | $16,200 |
Source: Public Records
Tax History Compared to Growth
Tax History
| Year | Tax Paid | Tax Assessment Tax Assessment Total Assessment is a certain percentage of the fair market value that is determined by local assessors to be the total taxable value of land and additions on the property. | Land | Improvement |
|---|---|---|---|---|
| 2025 | $1,180 | $244,500 | $92,600 | $151,900 |
| 2024 | $1,180 | $225,100 | $87,700 | $137,400 |
| 2023 | $1,086 | $199,700 | $84,300 | $115,400 |
| 2022 | $1,184 | $204,300 | $82,600 | $121,700 |
| 2021 | $1,064 | $166,300 | $62,600 | $103,700 |
| 2020 | $1,013 | $150,600 | $55,900 | $94,700 |
| 2019 | $1,012 | $141,600 | $55,900 | $85,700 |
| 2018 | $991 | $135,000 | $48,000 | $87,000 |
| 2017 | $715 | $91,200 | $48,000 | $43,200 |
| 2016 | $696 | $84,300 | $40,400 | $43,900 |
| 2015 | $638 | $73,300 | $40,900 | $32,400 |
| 2014 | $586 | $66,800 | $39,100 | $27,700 |
Source: Public Records
Map
Nearby Homes