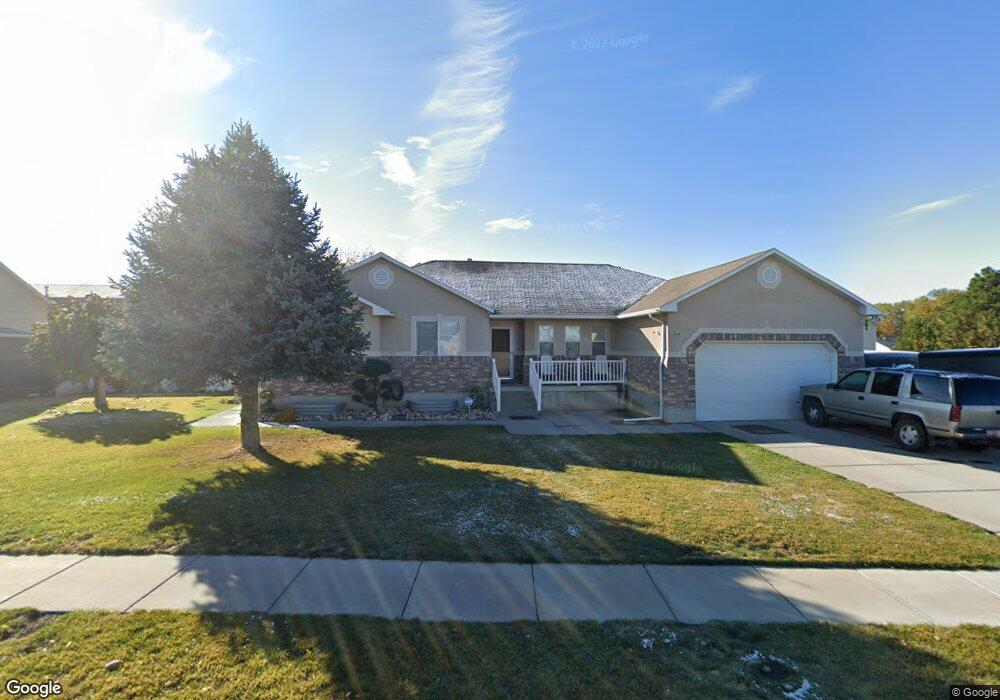
847 W 1090 N Clearfield, UT 84015
Estimated Value: $496,000 - $596,672
3
Beds
3
Baths
3,792
Sq Ft
$150/Sq Ft
Est. Value
About This Home
This home is located at 847 W 1090 N, Clearfield, UT 84015 and is currently estimated at $567,168, approximately $149 per square foot. 847 W 1090 N is a home located in Davis County with nearby schools including Clinton Elementary School, Sunset Junior High School, and Clearfield High School.
Ownership History
Date
Name
Owned For
Owner Type
Purchase Details
Closed on
Aug 23, 2010
Sold by
Thrall Niel H and Thrall Joyce
Bought by
Thrall Neil H and Thrall Joyce
Current Estimated Value
Home Financials for this Owner
Home Financials are based on the most recent Mortgage that was taken out on this home.
Original Mortgage
$239,776
Outstanding Balance
$156,173
Interest Rate
4.25%
Mortgage Type
FHA
Estimated Equity
$410,995
Purchase Details
Closed on
Mar 1, 2004
Sold by
Randall Wilson Construction Inc
Bought by
Thrall Neil H and Thrall Joyce
Purchase Details
Closed on
Dec 11, 2003
Sold by
Randall E Wilson Construction Inc
Bought by
Thrall Neil H and Thrall Joyce
Home Financials for this Owner
Home Financials are based on the most recent Mortgage that was taken out on this home.
Original Mortgage
$170,120
Interest Rate
4.12%
Mortgage Type
Purchase Money Mortgage
Purchase Details
Closed on
Jun 2, 2003
Sold by
Weber State University
Bought by
Randall Wilson Construction Inc
Create a Home Valuation Report for This Property
The Home Valuation Report is an in-depth analysis detailing your home's value as well as a comparison with similar homes in the area
Home Values in the Area
Average Home Value in this Area
Purchase History
| Date | Buyer | Sale Price | Title Company |
|---|---|---|---|
| Thrall Neil H | -- | Inwest Title Services Inc | |
| Thrall Neil H | -- | Intermountain Title | |
| Thrall Neil H | -- | Intermountain Title & Escrow | |
| Randall Wilson Construction Inc | -- | Home Abst & Title Co | |
| Weber State University | -- | Home Abst & Title Co |
Source: Public Records
Mortgage History
| Date | Status | Borrower | Loan Amount |
|---|---|---|---|
| Open | Thrall Neil H | $239,776 | |
| Previous Owner | Thrall Neil H | $170,120 | |
| Closed | Thrall Neil H | $32,250 |
Source: Public Records
Tax History Compared to Growth
Tax History
| Year | Tax Paid | Tax Assessment Tax Assessment Total Assessment is a certain percentage of the fair market value that is determined by local assessors to be the total taxable value of land and additions on the property. | Land | Improvement |
|---|---|---|---|---|
| 2025 | $3,169 | $304,701 | $100,238 | $204,463 |
| 2024 | $3,050 | $294,800 | $109,116 | $185,684 |
| 2023 | $2,896 | $518,000 | $126,020 | $391,980 |
| 2022 | $3,241 | $320,650 | $74,814 | $245,836 |
| 2021 | $3,039 | $446,000 | $97,521 | $348,479 |
| 2020 | $2,658 | $386,000 | $84,979 | $301,021 |
| 2019 | $2,565 | $364,000 | $95,415 | $268,585 |
| 2018 | $2,374 | $331,000 | $80,095 | $250,905 |
| 2016 | $2,154 | $155,045 | $31,621 | $123,424 |
| 2015 | $2,129 | $145,750 | $31,621 | $114,129 |
| 2014 | $1,971 | $137,061 | $31,621 | $105,440 |
| 2013 | -- | $134,812 | $27,604 | $107,208 |
Source: Public Records
Map
Nearby Homes