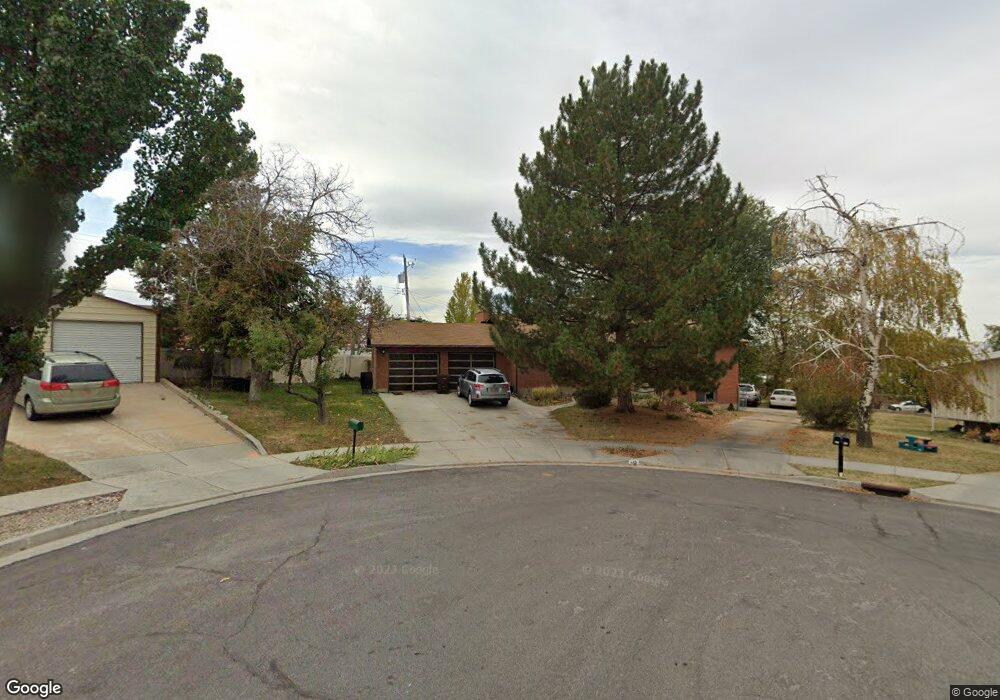
847 W 4050 S Bountiful, UT 84010
Estimated Value: $571,000 - $663,645
6
Beds
3
Baths
1,344
Sq Ft
$463/Sq Ft
Est. Value
About This Home
This home is located at 847 W 4050 S, Bountiful, UT 84010 and is currently estimated at $622,161, approximately $462 per square foot. 847 W 4050 S is a home located in Davis County with nearby schools including Adelaide School, South Davis Junior High School, and Woods Cross High School.
Ownership History
Date
Name
Owned For
Owner Type
Purchase Details
Closed on
Apr 12, 2024
Sold by
Passey Tonya S
Bought by
Rueckert Barbara A and Reilly Marcie A
Current Estimated Value
Purchase Details
Closed on
Mar 4, 2024
Sold by
Rueckert Barbara A and Reilly Marcie A
Bought by
Bass Sonya V
Purchase Details
Closed on
May 27, 2009
Sold by
Passey Darrell S
Bought by
Passey Tonya S
Home Financials for this Owner
Home Financials are based on the most recent Mortgage that was taken out on this home.
Original Mortgage
$103,000
Interest Rate
4.44%
Mortgage Type
New Conventional
Purchase Details
Closed on
Feb 25, 1999
Sold by
Passey L Keith
Bought by
Passey Darrell S and Passey Tonya S
Home Financials for this Owner
Home Financials are based on the most recent Mortgage that was taken out on this home.
Original Mortgage
$135,000
Interest Rate
6.78%
Create a Home Valuation Report for This Property
The Home Valuation Report is an in-depth analysis detailing your home's value as well as a comparison with similar homes in the area
Home Values in the Area
Average Home Value in this Area
Purchase History
| Date | Buyer | Sale Price | Title Company |
|---|---|---|---|
| Rueckert Barbara A | -- | None Listed On Document | |
| Bass Sonya V | -- | None Listed On Document | |
| Passey Tonya S | -- | Advanced Title Ins Ag | |
| Passey Darrell S | -- | Associated Title Company |
Source: Public Records
Mortgage History
| Date | Status | Borrower | Loan Amount |
|---|---|---|---|
| Previous Owner | Passey Tonya S | $103,000 | |
| Previous Owner | Passey Darrell S | $135,000 |
Source: Public Records
Tax History Compared to Growth
Tax History
| Year | Tax Paid | Tax Assessment Tax Assessment Total Assessment is a certain percentage of the fair market value that is determined by local assessors to be the total taxable value of land and additions on the property. | Land | Improvement |
|---|---|---|---|---|
| 2024 | $3,343 | $309,650 | $195,982 | $113,668 |
| 2023 | $2,861 | $473,000 | $274,105 | $198,895 |
| 2022 | $2,874 | $275,550 | $148,279 | $127,271 |
| 2021 | $2,614 | $380,000 | $194,369 | $185,631 |
| 2020 | $2,373 | $337,000 | $163,255 | $173,745 |
| 2019 | $2,385 | $332,000 | $154,648 | $177,352 |
| 2018 | $2,194 | $305,000 | $151,208 | $153,792 |
| 2016 | $1,726 | $137,005 | $57,366 | $79,639 |
| 2015 | $1,597 | $120,395 | $57,366 | $63,029 |
| 2014 | $1,528 | $117,642 | $57,366 | $60,276 |
| 2013 | -- | $110,652 | $47,957 | $62,695 |
Source: Public Records
Map
Nearby Homes
- 246 N Glenwood Way
- 2420 S Orchard Dr
- 79 N Orchard Dr
- 302 Odell Ln
- 189 E 210 N Unit 8
- 93 N Valley View Dr
- 366 N 175 E
- 70 E North Town Ln
- 266 Oak Dr
- 178 N Valley View Dr
- 310 N 675 E
- 520 Lacey Way
- 25 E Center St Unit 10
- 131 E 475 N
- 330 Pellinore St Unit 43
- 174 Wilson Rd
- 585 Marialana Way
- 426 N Orchard Dr Unit 5
- 562 Lancelot Dr Unit 60
- 464 N Frontage Rd
- 822 W 4100 S
- 848 W 4050 S
- 816 W 4100 S
- 824 W 4100 S
- 4053 S 850 W
- 4033 S 850 W
- 812 W 4100 S
- 838 W 4050 S
- 837 W 4050 S
- 836 W 4100 S
- 372 E Sycamore Grove Ln
- 836 W 4050 S
- 378 E Sycamore Grove Ln Unit 104
- 4001 S 850 W
- 808 W 4100 S
- 366 E Sycamore Grove Ln
- 384 E Sycamore Grove Ln Unit 105
- 818 W 4050 S
- 4117 S 825 W
- 817 W 4100 S