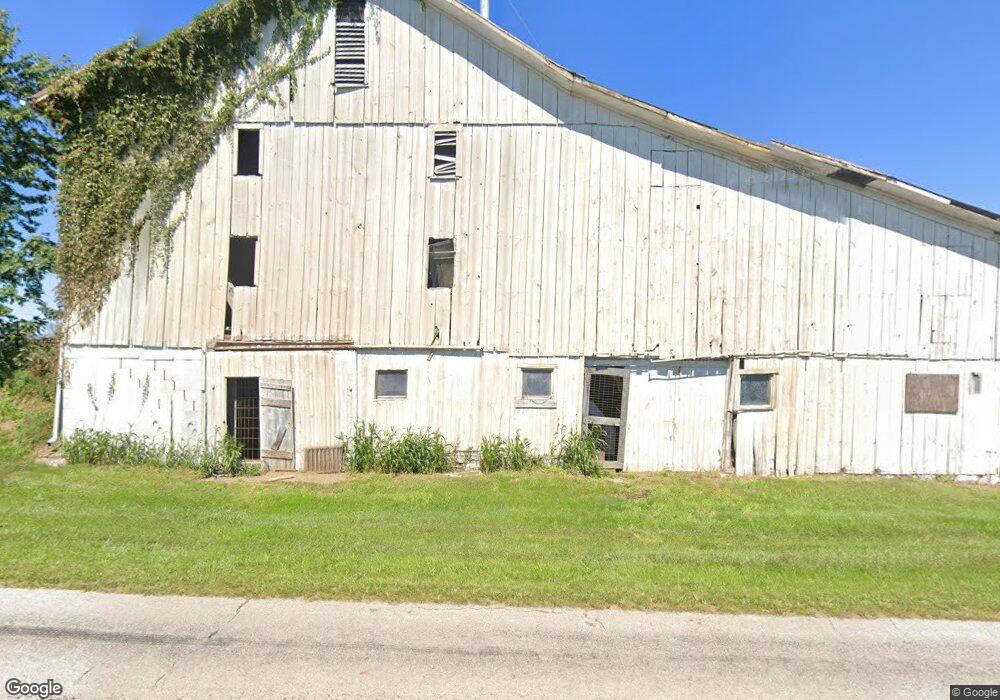
8470 Five Points Rd Smithville, OH 44677
Estimated Value: $225,000 - $288,000
4
Beds
2
Baths
1,938
Sq Ft
$131/Sq Ft
Est. Value
About This Home
This home is located at 8470 Five Points Rd, Smithville, OH 44677 and is currently estimated at $254,160, approximately $131 per square foot. 8470 Five Points Rd is a home located in Wayne County with nearby schools including Green Elementary School, Green Middle School, and Smithville High School.
Ownership History
Date
Name
Owned For
Owner Type
Purchase Details
Closed on
Aug 24, 2022
Sold by
Craemer Paul A
Bought by
Creamer Glenn Patrick and Craemer Alexis Marie
Current Estimated Value
Home Financials for this Owner
Home Financials are based on the most recent Mortgage that was taken out on this home.
Original Mortgage
$77,000
Outstanding Balance
$73,633
Interest Rate
5.54%
Mortgage Type
New Conventional
Estimated Equity
$180,527
Purchase Details
Closed on
Sep 25, 2005
Sold by
Craemer Paul A and Craemer Patricia E
Bought by
Craemer Paul A and Craemer Patricia E
Purchase Details
Closed on
May 1, 1991
Sold by
Brooks Janice C
Bought by
Craemer Paul A and Craemer Patricia
Purchase Details
Closed on
Mar 28, 1991
Sold by
Brooks Richard A and Brooks Janice
Bought by
Brooks Janice C
Purchase Details
Closed on
Oct 20, 1988
Sold by
Hilligas Harold F and Hilligas Mild
Bought by
Brooks Richard A and Brooks Janice
Create a Home Valuation Report for This Property
The Home Valuation Report is an in-depth analysis detailing your home's value as well as a comparison with similar homes in the area
Purchase History
| Date | Buyer | Sale Price | Title Company |
|---|---|---|---|
| Creamer Glenn Patrick | -- | -- | |
| Craemer Paul A | -- | -- | |
| Craemer Paul A | $75,000 | -- | |
| Brooks Janice C | -- | -- | |
| Brooks Richard A | $72,000 | -- |
Source: Public Records
Mortgage History
| Date | Status | Borrower | Loan Amount |
|---|---|---|---|
| Open | Creamer Glenn Patrick | $77,000 |
Source: Public Records
Tax History
| Year | Tax Paid | Tax Assessment Tax Assessment Total Assessment is a certain percentage of the fair market value that is determined by local assessors to be the total taxable value of land and additions on the property. | Land | Improvement |
|---|---|---|---|---|
| 2024 | $2,446 | $59,630 | $25,600 | $34,030 |
| 2023 | $2,502 | $61,550 | $25,600 | $35,950 |
| 2022 | $2,090 | $44,600 | $18,550 | $26,050 |
| 2021 | $2,118 | $44,600 | $18,550 | $26,050 |
| 2020 | $2,144 | $44,600 | $18,550 | $26,050 |
| 2019 | $2,000 | $40,130 | $16,420 | $23,710 |
| 2018 | $1,971 | $40,130 | $16,420 | $23,710 |
| 2017 | $1,939 | $40,130 | $16,420 | $23,710 |
| 2016 | $1,908 | $39,000 | $16,420 | $22,580 |
| 2015 | $1,921 | $39,000 | $16,420 | $22,580 |
| 2014 | $1,789 | $39,000 | $16,420 | $22,580 |
| 2013 | $1,847 | $37,510 | $16,130 | $21,380 |
Source: Public Records
Map
Nearby Homes
- 6110 Akron Rd
- 1005 Heatherwood Ln
- 1773 Blackberry Ln
- 1315 Back Massillon Rd
- 1846 Tammy Ct
- 9623 Yoder Rd
- 422 N Crown Hill Rd
- 8191 Back Orrville Rd
- 222 Washington Blvd
- 620 W High St
- 822 W Market St
- 409 W Church St
- 732 Markley Ave
- 410 W Oak St
- 122 W Paradise St
- 851 Cleveland Ave
- 704 Homestead Pointe Dr
- 660 Millborne Rd
- 2710 E Hutton Rd
- 1474 N Honeytown Rd
- 7488 5 Points Rd
- 0 5 Points Rd
- 5901 Egypt Rd
- 5837 Egypt Rd
- 0 Egypt Rd Unit 3161746
- 0 Egypt Rd Unit 86183
- 6293 Egypt Rd
- 6293 Egypt Rd
- 8061 Five Points Rd
- 6429 Egypt Rd
- 6459 Egypt Rd
- 5544 Egypt Rd
- 7945 Five Points Rd
- 7967 Five Points Rd
- 8895 Five Points Rd
- 7890 Five Points Rd
- 5500 Egypt Rd
- 8899 Five Points Rd
- 7821 Five Points Rd
- 8953 Five Points Rd
Your Personal Tour Guide
Ask me questions while you tour the home.