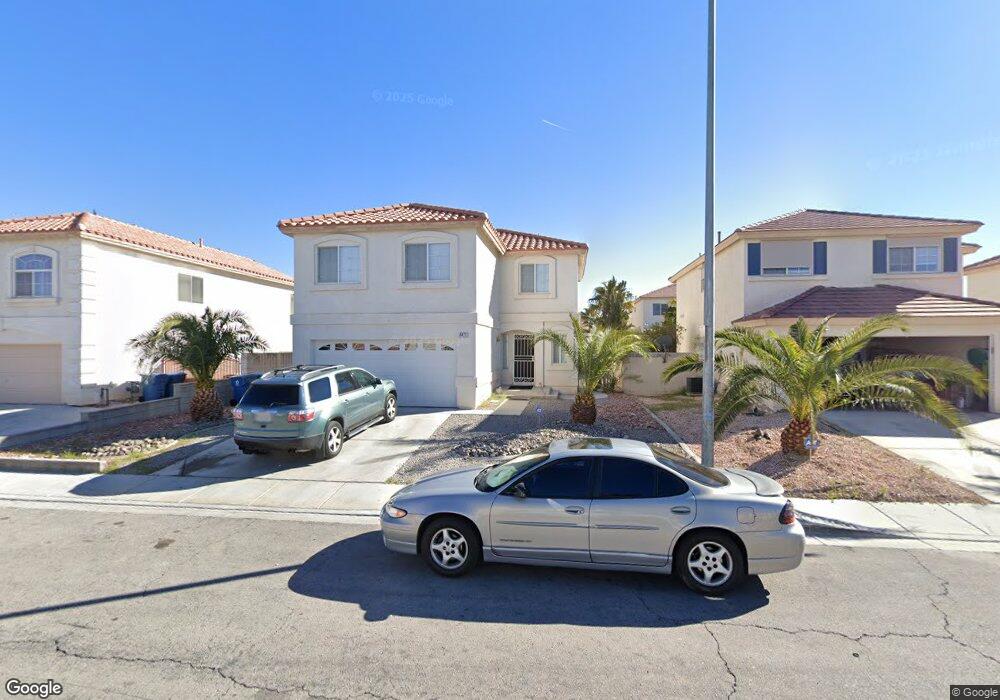
8471 Canvas Vest Ct Las Vegas, NV 89113
Estimated Value: $464,000 - $468,000
4
Beds
3
Baths
1,807
Sq Ft
$258/Sq Ft
Est. Value
About This Home
This home is located at 8471 Canvas Vest Ct, Las Vegas, NV 89113 and is currently estimated at $466,043, approximately $257 per square foot. 8471 Canvas Vest Ct is a home located in Clark County with nearby schools including Lucille S. Rogers Elementary School, Grant Sawyer Middle School, and Durango High School.
Ownership History
Date
Name
Owned For
Owner Type
Purchase Details
Closed on
Jun 29, 2010
Sold by
Navarro Alicia
Bought by
Emeru Zewdu T
Current Estimated Value
Home Financials for this Owner
Home Financials are based on the most recent Mortgage that was taken out on this home.
Original Mortgage
$126,299
Outstanding Balance
$82,999
Interest Rate
4.5%
Mortgage Type
FHA
Estimated Equity
$383,044
Purchase Details
Closed on
Jun 28, 2010
Sold by
Getahune Bezuayha B
Bought by
Emeru Zewdu T
Home Financials for this Owner
Home Financials are based on the most recent Mortgage that was taken out on this home.
Original Mortgage
$126,299
Outstanding Balance
$82,999
Interest Rate
4.5%
Mortgage Type
FHA
Estimated Equity
$383,044
Purchase Details
Closed on
Apr 26, 2000
Sold by
American West Homes Inc
Bought by
Navarro Alicia
Home Financials for this Owner
Home Financials are based on the most recent Mortgage that was taken out on this home.
Original Mortgage
$117,550
Interest Rate
10%
Create a Home Valuation Report for This Property
The Home Valuation Report is an in-depth analysis detailing your home's value as well as a comparison with similar homes in the area
Home Values in the Area
Average Home Value in this Area
Purchase History
| Date | Buyer | Sale Price | Title Company |
|---|---|---|---|
| Emeru Zewdu T | $128,000 | Lawyers Title Of Nevada Cen | |
| Emeru Zewdu T | -- | Lawyers Title Of Nevada Cen | |
| Navarro Alicia | $146,975 | First American Title Co |
Source: Public Records
Mortgage History
| Date | Status | Borrower | Loan Amount |
|---|---|---|---|
| Open | Emeru Zewdu T | $126,299 | |
| Previous Owner | Navarro Alicia | $117,550 |
Source: Public Records
Tax History Compared to Growth
Tax History
| Year | Tax Paid | Tax Assessment Tax Assessment Total Assessment is a certain percentage of the fair market value that is determined by local assessors to be the total taxable value of land and additions on the property. | Land | Improvement |
|---|---|---|---|---|
| 2025 | $1,743 | $112,011 | $45,500 | $66,511 |
| 2024 | $1,692 | $112,011 | $45,500 | $66,511 |
| 2023 | $1,692 | $103,437 | $40,600 | $62,837 |
| 2022 | $1,801 | $87,296 | $29,750 | $57,546 |
| 2021 | $1,668 | $84,074 | $29,400 | $54,674 |
| 2020 | $1,546 | $81,193 | $26,950 | $54,243 |
| 2019 | $1,449 | $76,516 | $23,100 | $53,416 |
| 2018 | $1,383 | $71,114 | $19,950 | $51,164 |
| 2017 | $2,054 | $70,046 | $18,200 | $51,846 |
| 2016 | $1,295 | $64,805 | $14,000 | $50,805 |
| 2015 | $1,292 | $50,379 | $10,500 | $39,879 |
| 2014 | $1,252 | $41,402 | $7,700 | $33,702 |
Source: Public Records
Map
Nearby Homes
- 6128 Stetson Cove Ct
- 6168 Stetson Cove Ct
- Kaufman Plan at Tenaya Springs
- Avondale Plan at Tenaya Springs
- Lovell Plan at Tenaya Springs
- 5835 Rainbow Trout Ct
- 6256 Haiku Stairs St
- 6161 Andover Wood Rd
- 5766 Whimsical St
- 5762 Whimsical St
- 8555 W Russell Rd Unit 1026
- 8162 Seminario Ave
- 5758 Whimsical St
- 5754 Whimsical St
- 5750 Whimsical St
- 5746 Whimsical St
- 5742 Whimsical St
- Barclay Plan at Majestic Point South
- Bedford Plan at Majestic Point South
- Griffin Plan at Majestic Point South
- 8481 Canvas Vest Ct
- 8461 Canvas Vest Ct
- 8474 Montana Stream Ave
- 8451 Canvas Vest Ct
- 8491 Canvas Vest Ct
- 8464 Montana Stream Ave
- 8454 Montana Stream Ave
- 8472 Canvas Vest Ct
- 8494 Montana Stream Ave
- 8441 Canvas Vest Ct
- 8462 Canvas Vest Ct
- 8482 Canvas Vest Ct
- 8492 Canvas Vest Ct
- 8452 Canvas Vest Ct
- 8444 Montana Stream Ave
- 8431 Canvas Vest Ct
- 8442 Canvas Vest Ct
- 8434 Montana Stream Ave
- 8473 Chinook Candy Ct
- 8483 Chinook Candy Ct