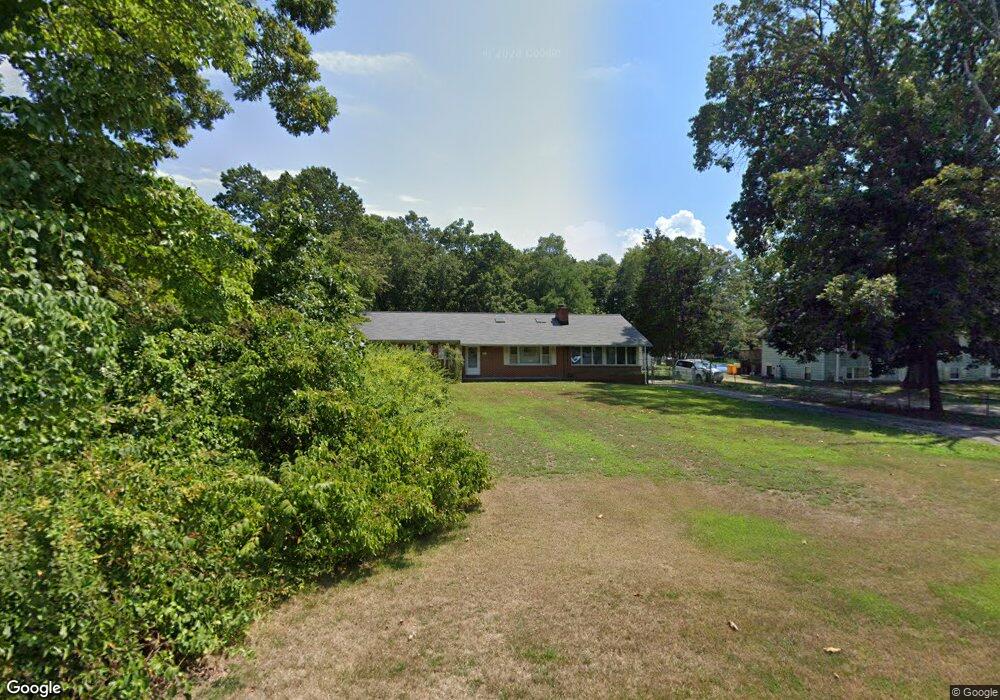
8473 Bussenius Rd Pasadena, MD 21122
Lake Shore NeighborhoodEstimated Value: $533,000 - $604,000
Studio
3
Baths
2,108
Sq Ft
$270/Sq Ft
Est. Value
About This Home
This home is located at 8473 Bussenius Rd, Pasadena, MD 21122 and is currently estimated at $569,090, approximately $269 per square foot. 8473 Bussenius Rd is a home located in Anne Arundel County with nearby schools including Lake Shore Elementary School, Chesapeake Bay Middle School, and Chesapeake High School.
Ownership History
Date
Name
Owned For
Owner Type
Purchase Details
Closed on
Mar 16, 2025
Sold by
Zamostny Leroy J and Zamostny Mildred E
Bought by
Zamostny Leroy J and Rollins Ruby Kathleen
Current Estimated Value
Purchase Details
Closed on
Oct 26, 2011
Sold by
Zamostny Kathleen N
Bought by
Zamostny Leroy J and Zamostny Mildred
Home Financials for this Owner
Home Financials are based on the most recent Mortgage that was taken out on this home.
Original Mortgage
$340,774
Interest Rate
4.01%
Mortgage Type
FHA
Purchase Details
Closed on
Feb 11, 2000
Sold by
Zamostny Leroy J
Bought by
Zamostny Leroy J and Zamostny Kathleen N
Purchase Details
Closed on
Mar 24, 1987
Sold by
Heinz Chas J
Bought by
Zamostny Leroy J
Home Financials for this Owner
Home Financials are based on the most recent Mortgage that was taken out on this home.
Original Mortgage
$104,500
Interest Rate
9.03%
Create a Home Valuation Report for This Property
The Home Valuation Report is an in-depth analysis detailing your home's value as well as a comparison with similar homes in the area
Home Values in the Area
Average Home Value in this Area
Purchase History
We collect this data history from publicly available records. To have your information removed, we recommend requesting removal directly through your county’s website.
| Date | Buyer | Sale Price | Title Company |
|---|---|---|---|
| Zamostny Leroy J | -- | None Listed On Document | |
| Zamostny Leroy J | -- | None Listed On Document | |
| Zamostny Leroy J | $163,000 | None Available | |
| Zamostny Leroy J | -- | -- | |
| Zamostny Leroy J | $110,000 | -- |
Source: Public Records
Mortgage History
We collect this data history from publicly available records. To have your information removed, we recommend requesting removal directly through your county’s website.
| Date | Status | Borrower | Loan Amount |
|---|---|---|---|
| Previous Owner | Zamostny Leroy J | $340,774 | |
| Previous Owner | Zamostny Leroy J | $104,500 |
Source: Public Records
Tax History
| Year | Tax Paid | Tax Assessment Tax Assessment Total Assessment is a certain percentage of the fair market value that is determined by local assessors to be the total taxable value of land and additions on the property. | Land | Improvement |
|---|---|---|---|---|
| 2025 | $3,721 | $485,467 | -- | -- |
| 2024 | $3,721 | $462,200 | $234,800 | $227,400 |
| 2023 | $3,618 | $448,867 | $0 | $0 |
| 2022 | $3,388 | $435,533 | $0 | $0 |
| 2020 | $3,223 | $407,900 | $0 | $0 |
| 2019 | $2,530 | $393,600 | $0 | $0 |
| 2018 | $3,846 | $379,300 | $164,800 | $214,500 |
| 2017 | $2,981 | $371,600 | $0 | $0 |
| 2016 | -- | $363,900 | $0 | $0 |
| 2015 | -- | $356,200 | $0 | $0 |
| 2014 | -- | $356,200 | $0 | $0 |
Source: Public Records
Map
Nearby Homes
- 18 Fallon Dr
- 8408 Maryland Rd
- 8331 Woodland Rd
- 54 Dayton Dr
- 1243 Silver Run Dr
- 4346 Mountain Rd
- 828A Swift Rd
- 200 Kentucky Ave
- 148 Waldo Rd
- 222 Kentucky Ave
- 218 Virginia Ave
- 157 Woodsway
- 209 New York Ave
- 4414 Purple Martins Rd
- 1499 Westcliff Dr
- 180 Waldo Rd
- 178 9th St
- 0 Maryland Ave
- 1631 Carnoustie Dr
- 779 Olivia Way
- 8479 Bussenius Rd
- 8469 Bussenius Rd
- 8481 Bussenius Rd
- 8470 Bussenius Rd
- 8379 Oak Dr
- 8465 Bussenius Rd
- 8464 Bussenius Rd
- 8468 Bussenius Rd
- 8487 Bussenius Rd
- 8383 Oak Dr
- 8383 Oak Dr
- 8442 Garland Rd
- 8383 Carol Dr
- 8375 Oak Dr
- 8467 Bussenius Rd
- 8444 Garland Rd
- 8446 Garland Rd
- 8382 Carol Dr
- 8440 Garland Rd
- 8450 Garland Rd
Your Personal Tour Guide
Ask me questions while you tour the home.