Estimated Value: $611,000 - $666,497
2
Beds
3
Baths
2,352
Sq Ft
$270/Sq Ft
Est. Value
About This Home
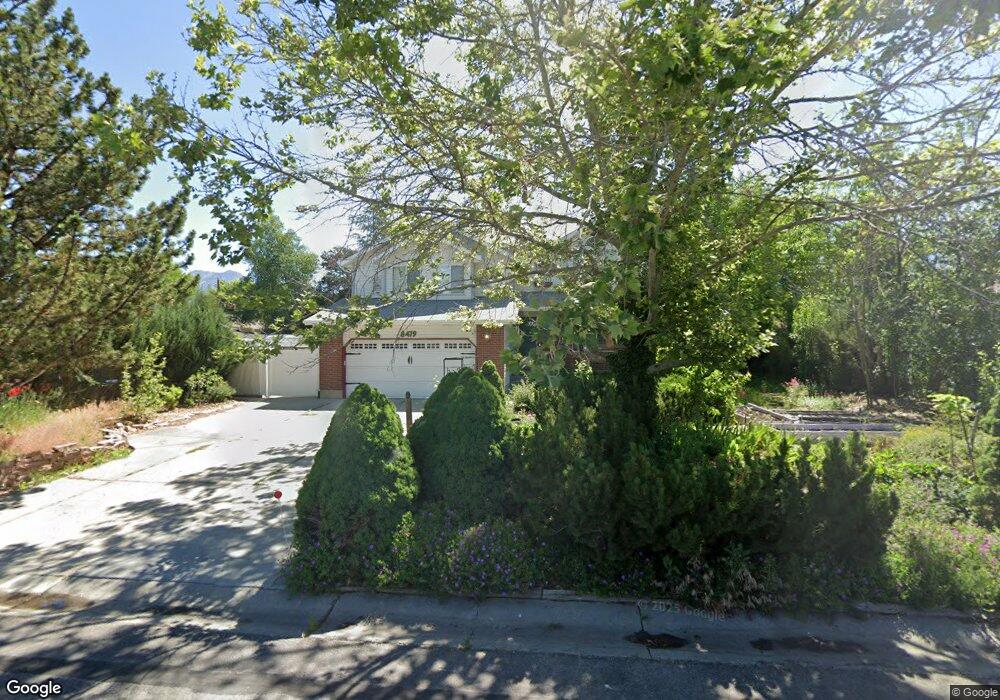
This home is located at 8479 S 1330 E, Sandy, UT 84093 and is currently estimated at $633,874, approximately $269 per square foot. 8479 S 1330 E is a home located in Salt Lake County with nearby schools including Peruvian Park Elementary School, Hillcrest High School, and Union Middle School.
Ownership History
Date
Name
Owned For
Owner Type
Purchase Details
Closed on
Apr 16, 2020
Sold by
Bird Bruce T
Bought by
Harooni Hooman Eshagh and Hosseini Mitra
Current Estimated Value
Home Financials for this Owner
Home Financials are based on the most recent Mortgage that was taken out on this home.
Original Mortgage
$402,573
Outstanding Balance
$361,307
Interest Rate
4.12%
Mortgage Type
FHA
Estimated Equity
$272,567
Purchase Details
Closed on
Dec 23, 1996
Sold by
Spencer Kathleen K and Spencer Evan S
Bought by
Bird Bruce T
Home Financials for this Owner
Home Financials are based on the most recent Mortgage that was taken out on this home.
Original Mortgage
$151,200
Interest Rate
7.59%
Purchase Details
Closed on
Mar 23, 1994
Sold by
Bohne Cleve
Bought by
Spencer Kathleen K and Spencer Evan S
Home Financials for this Owner
Home Financials are based on the most recent Mortgage that was taken out on this home.
Original Mortgage
$108,700
Interest Rate
7.21%
Create a Home Valuation Report for This Property
The Home Valuation Report is an in-depth analysis detailing your home's value as well as a comparison with similar homes in the area
Home Values in the Area
Average Home Value in this Area
Purchase History
| Date | Buyer | Sale Price | Title Company |
|---|---|---|---|
| Harooni Hooman Eshagh | -- | Sutherland Title | |
| Bird Bruce T | -- | -- | |
| Spencer Kathleen K | -- | -- |
Source: Public Records
Mortgage History
| Date | Status | Borrower | Loan Amount |
|---|---|---|---|
| Open | Harooni Hooman Eshagh | $402,573 | |
| Previous Owner | Bird Bruce T | $151,200 | |
| Previous Owner | Spencer Kathleen K | $108,700 |
Source: Public Records
Tax History
| Year | Tax Paid | Tax Assessment Tax Assessment Total Assessment is a certain percentage of the fair market value that is determined by local assessors to be the total taxable value of land and additions on the property. | Land | Improvement |
|---|---|---|---|---|
| 2025 | $3,772 | $593,800 | $143,500 | $450,300 |
| 2024 | $3,772 | $573,200 | $134,100 | $439,100 |
| 2023 | $3,889 | $578,500 | $127,500 | $451,000 |
| 2022 | $3,963 | $587,100 | $125,000 | $462,100 |
| 2021 | $3,357 | $436,100 | $95,400 | $340,700 |
| 2020 | $3,050 | $370,900 | $95,400 | $275,500 |
| 2019 | $2,650 | $320,300 | $90,000 | $230,300 |
| 2016 | $2,669 | $304,200 | $90,000 | $214,200 |
Source: Public Records
Map
Nearby Homes
- 1371 Sudbury Ave
- 8352 S 1330 E
- 8411 S 1475 E
- 1430 E 8685 S
- 8569 Round Stone Cove
- 8569 Round Stone Cove Unit 8
- 8492 S Mesa Dr
- 8797 S Capella Way
- 1579 E 8730 S
- 8485 S Harvard Park Dr
- 8373 S 1100 E Unit 39
- 8583 S Harvard Park Dr
- 1627 E Mulberry Way
- 8857 S Capella Way
- 8136 S Cottonwood Hills Cir
- 8638 Piper Ln
- 991 Merewood Ct
- 8642 S Cessna Cir
- 8935 Quarry Stone Way
- 8971 Valley Bend Ct
Your Personal Tour Guide
Ask me questions while you tour the home.